Download

1 / 29
290 likes | 315 Views
This article explores the behavior of 2D systems with dipolar interaction, focusing on microemulsion phases and phase transitions between liquid and crystal states. It also discusses the effects of finite size corrections and surface energy on the shape of minority phases. The study includes comparisons with the Coulomb case and related phenomena observed in MOSFETs and double p-GaAs layers. Experimental results reveal unique temperature and magnetic field dependencies of resistance and drag in these systems.

E N D
2D microemulsion phases in Bose and Fermi systems with dipolar interaction B. Spivak, UW S. Kivelson, Stanford, S. Sondhi, D. Huse, C. Lamman, Princeton
interaction energy can be characterized by a parameter rs =Epot /Ekin ( interaction energy is V(r) ~1/rg ) 3He and 4He(g>2 ) are crystals at large n
a. Transitions between the liquid and the crystal • should be of first order. • (L.D. Landau, S. Brazovskii) • b. As a function of density 2D first order phase • transitions in systems with dipolar or Coulomb • interaction are forbidden. • There are 2D quantum phases intermediate between • the liquid and the crystal (micro-emulsion phases)
Phase separation crystal liquid phase separated region. n nW nc nL There is an interval of densities nW<n<nL near the critical ncwhere phase separation must occur
Elementary explanation: Finite size corrections to the capacitance R is the droplet radius Part of the bulk energy This contribution to the surface energy is due to a finite size correction to the capacitance of the capacitor. It is negative and is proportional to –R ln (R/d)
To find the shape of the minority phase one must minimize the surface energy at a given area of the minority phase In the case of dipolar interaction g> 0 is the microscopic surface energy S At large L the surface energy is negative!
Mean field phase diagram in the case of isotropic surface tension A sequence of more complicated patterns. A sequence of more complicated patterns. crystal liquid. Bubbles of C Bubbles of L Stripes n Transitions are continuous. They are similar to Lifshitz points.
Effective free energy in the case of the first order phase transition which is close to the second order.
Mean field phase diagram stripes cristal hexagons hexagons liquid. n
Mean field phase diagram of microemulsions stripes cristal hexagons hexagons liquid. n liquid. hexagons stripes of h Transitions are continuous. They are similar to Lifshitz points.
zero temperature hydrodynamics of all mictoemulcion phases is equavalent to supersolid hydrodynamics finite temperature hydrodynamics of the stripe phases is equivalent to super-smectic hydrodynamics
Coloumb case is qualitatively similar to the dipolar case (Jamei, Kivelson, Spivak)
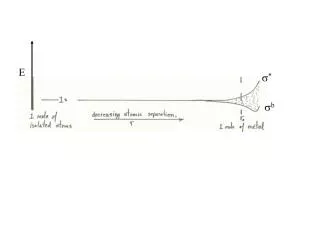
The electron band structure in MOSFET’s oxide eV 2D electron gas. Metal Si d + - As the the parameter dn1/2 decreases the electron-electron interaction changes from Coulomb V~1/r to dipole V~1/r3 form. + - + - + - n-1/2
Phase diagram of 2D electrons in MOSFET’s . ( T=0 ) Inverse distance to the gate 1/d MOSFET’s important for applications. FERMI LIQUID correlated electrons. WIGNER CRYSTAL n Microemulsion phases. In green areas where quantum effects are important. Experiments by V. Pudalov, S. Kravchenko, M. Sarachik, et al.
Experiments on the temperature and the parallel magnetic field dependences of the resistance of single electronic layers.
T-dependence of the resistance of 2D electrons at large rs in the “metallic” regime (G>>e2/ h) Gao at al, Cond.mat 0308003 Kravchenko et al p-GaAs, p=1.3 10 cm-2 ; rs=30 Si MOSFET
B|| dependences of the resistance of Si MOSFET’s at different electron concentrations. Pudalov et al. A factor of order 6. There is a big positive magneto-resistance which saturates at large magnetic fields parallel to the plane.
B|| dependence of 2D p-GaAs at large rs and small wall thickness. Gao et al 1/3
Comparison T-dependences of the resistances of Si MOSFET’s at zero and large B|| M. Sarachik, S. Vitkalov B|| The parallel magnetic field suppresses the temperature dependence of the resistance of the metallic phase. The slopes differ by a factor 100 !!
G=70 e2/h Tsui et al. cond-mat/0406566 Gao et al The slope of the resistance dR/dT is dramatically suppressed by the parallel magnetic field. It changes the sign. Overall change of the modulus is more than factor 100 in Si MOSFET and a factor 10 in P-GaAs !
Do materials exist where the resistance has dielectric values R>>h/e2 and yet still increases as the temperature increases ?
If it is all business as usual: Why is there an apparent metal-insulator transition? Why is there such strong T and B|| dependence at low T, even in “metallic” samples with G>> e2/h? Why is the magneto-resistance positive at all? Why does B|| so effectively quench the T dependence of the resistance?
Experiments on the drag resistance of the double p-GaAs layers.
B|| dependence of the resistance and drag resistance of 2D p-GaAs at different temperatures Pillarisetty et al. PRL. 90, 226801 (2003)
T-dependence of the drag resistance in double layers of p-GaAs at different B|| Pillarisetty et al. PRL. 90, 226801 (2003)
If it is all business as usual: Why the drag resistance is 2-3 orders of magnitude larger than those expected from the Fermi liquid theory? Why is there such a strong T and B|| dependence of the drag? Why is the drag magneto-resistance positive at all? Why does B|| so effectively quench the T dependence of drag resistance? Why B|| dependences of the resistances of the individual layers and the drag resistance are very similar ?
T and H|| dependences of the crystal’s area. (Pomeranchuk effect). S and M are entropy and magnetization of the system. The entropy of the crystal is of spin origin and much larger than the entropy of the Fermi liquid. • As T and H|| increase, the crystal fraction grows. • At large H|| the spin entropy is frozen and the • crystal fraction is T- independent.
Conclusion: There are pure 2D electron phases which are intermediate between the Fermi liquid and the Wigner crystal .