Download

1 / 13
130 likes | 229 Views
Discover the benefits of a business information dashboard, including graphical displays for spotting trends, compiling key data in one place for easier analysis, and drill-down capabilities for in-depth insights. Learn Oak’s Simple 5-Step Approach and Unique Approach for implementing and refining your dashboard to suit your unique performance metrics.

E N D
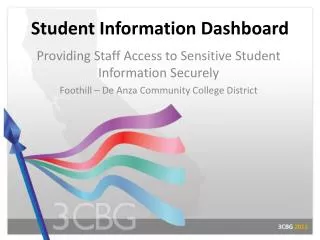
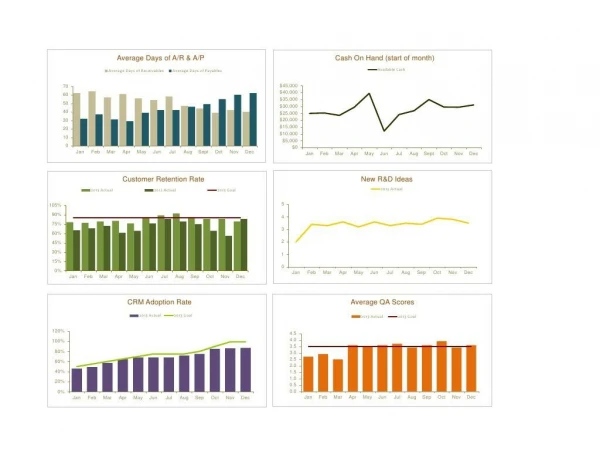
Merits of a dashboard • Graphical display allows you to spot trends at a glance • Key information from disparate reports compiled in one place provides “big picture” view and easier analysis • Drill-down to specific numbers of any graph with one mouse-click
For example… Click here for enlarged view of single chart
Enlarged view appears of individual graph... Double-click on chart…
“ I already get this information from another report! Why a dashboard? ”
Existing reports… • May only be text-based – a dashboard gives you visual displays • Often gives you a snapshot of current period only – a dashboard shows you trends • Are “silos” of information – a dashboard allows all key performance indicators (KPI’s) to be placed in one view to help understand inter-relationships among KPI’s and better hone in on problem areas
Oak’s Simple 5-Step Approach • Your company’s unique key performance metrics are identified • We have ideas and checklists for you • We find out where this information resides in your company • Various databases, manual information • We set up a “test” dashboard, inputting your historical data • The past 12 months, for example,for trends analysis
Oak’s Unique Approach • You use the dashboard for a few months, relying on manual-input of information • You let us know if it indeed captures what you want and is displayed like you want it • Let’s not integrate until you’re happy with everything • Final dashboard with automated data capturing is implemented
Manual Data Input During Trial Phase Data for all KPI’s are manually entered on one simple form
Oak’s Unique Approach • User-friendly reporting tool: Learning - - very easy to use. Ramp-up time - - begin using it immediately. Cost - - extremely affordable solution. • Initial manual input of data ensures: Data is indeed that which is most meaningful. Data is displayed as CEO or users want to see it. Strategic merits of the dashboard are immediately realized.
Put the Power of a Business Information Dashboard to Work for Your Company!