Download
1 / 28
280 likes | 382 Views
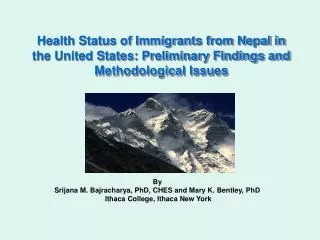
Health Status of Immigrants from Nepal in the United States: Preliminary Findings and Methodological Issues. By Srijana M. Bajracharya, PhD, CHES and Mary K. Bentley, PhD Ithaca College, Ithaca New York. Why study Nepalese Immigrants?.

E N D
Health Status of Immigrants from Nepal in the United States: Preliminary Findings and Methodological Issues By Srijana M. Bajracharya, PhD, CHES and Mary K. Bentley, PhD Ithaca College, Ithaca New York
Why study Nepalese Immigrants? • 1951- Immigrants from Nepal first come to the US. Due to geographical isolation, poverty, low literacy rates, and autocratic rule, very little immigration happened. • Early immigrants were mostly professionals educated in India or Europe, or students entering US Colleges and Universities • Unique opportunity to document health status of an immigrant population coming into US culture that is first generation. • To delineate the health effects of rapid acculturation into the US. from extreme poverty.
Why Nepalese? (continued) • Relatively small population of people- >1% of total US population. • Govt. data are fragmented or non-existent for this group of people • Less able to maintain traditional lifestyle in US. There are no specific ghetto areas (such as Chinatown) • Very close connections with family in Nepal and in US. • May make sampling non-immigrated and immigrated easier. • Immigrants have a clear understanding of cultural differences • Most Nepalese immigrants are bilingual.
Nepal, officially Kingdom of Nepal, constitutional monarchy in South Asia. Locked within the rugged ranges of the Himalayas, Nepal is bounded by the Tibet region of China on the north and India on the south, east, and west. It was cut off from the rest of the world until the early 1950s, when a palace revolution and the subsequent overthrow of the autocratic Rana dynasty marked the beginning of Nepal’s immergence into the modern world. Kathmandu is the largest city and capital.
The Himalayas, which comprise the highest mountain system in the world, extend through most of Nepal and help shape its northern border. Eight of the ten highest mountains in the world, including Mount Everest (8,850 m/29,035 ft), are located either wholly or partially in the country. The resulting geographic isolation has hindered development
The People of Nepal • We know relatively little about the health status indicators for people living in Nepal. The Infrastructure for collecting data is beginning to take shape and in 2003 the first formal census was conducted. • Most Nepalese in the US are first or second generation, and have family living in Nepal. • Although this tiny country is very isolated, there is a rich ethnic and racial mix, that dates back thousands of years.
Statistics:Total population: 25,284,463 GDP per capita (Intl $): 1,224 Life expectancy at birth m/f (years): 58.6/57.9 Healthy life expectancy at birth m/f (years): 48.7/49.1 Child mortality m/f (per 1000): 100/115 Adult mortality m/f (per 1000): 302/293 Total health expenditure per capita (Intl $): 66 Total health expenditure as % of GDP: 5.4 Statistics:Total population: 285,925,000 GDP per capita (Intl $): 34,637 Life expectancy at birth m/f (years): 74.3/79.5 Healthy life expectancy at birth m/f (years): 66.4/68.8 Child mortality m/f (per 1000): 9/7 Adult mortality m/f (per 1000): 144/83 Total health expenditure per capita (Intl $): 4,499 Total health expenditure as % of GDP: 13.0 Quality of Life Indicators (WHO 2004)Nepal Vs US
Caste/Ethnicityover 100 represented in Nepal Top 24 from first census data 2003
Ethnicity as Defined in the US Census • Nepal is clustered with Other Asian or with all Asian ethnicities. Typically China, Taiwan, Filipino, Korean, East Indian, and Other Asian or just Asian are census options • Within the Asian Clustering there are over 50 cultures represented in over 50 countries. • Huge differences in etiological factors relative to Morbidity and Mortality exist within this Asian cluster. • Current censes data presents a very ethnocentric view of Asian culture, that provides little if any data relevant for behavioral risk factors and quality of life indicators for these unique populations.
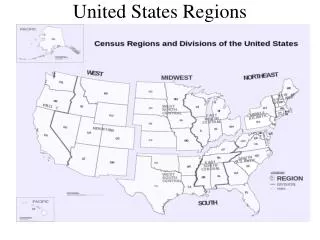
Federal Classification of Ethnic Groups in the United States White 75.1% African Americans 12.3% Hispanics 12.5% Pacific Islander 0.1% Native Americans 0.9% Asian 3.6% U.S. Bureau of the Census, Population Division, (2001)
Proportion of Nepalese Among Other Asians National Origin Population Percent Total 11,898,828 100.0% Asian Indian 189,959 16.0 Bangladeshi 57,412 0.5 Burmese 16,720 0.1 Cambodian 206,052 1.7 Chinese (except Tawainese) 2,734,841 23.0 Filipino 2,364,815 19.9 Hmong 186,310 1.6 Indonesian 63,073 0.5 Japanese 1,148,932 9.7 Korean 1,228,427 10.3 Laotian 198,203 1.7 Malaysian 18,566 0.2 Nepalese 9,399 0.1 Okinawan 10,599 0.1 Pakistani 204,309 1.7 Sri Lankan 24,587 0.2 Tawainese 144,795 1.2 Thai 150,283 1.3 Vietnamese 1,223,736 10.3 Other Asian 369,430 3.1 * Bhutan, Indo China, Maldivia and Singapore all have U.S. populations which are <0.1%
Our Preliminary Survey • Modified version of the BRFS- looking at specific items we felt important based on literature review and available surveillance data • Sample- convenient sample from various areas
Perceived Health Status and Health Behaviors of Nepalese Immigrants and Their Children: A Pilot Study Research Questions: • What were the perceived health status, quality of life, and values of Nepalese people? • What was the status of their behavioral risk factors? • What was the status of their health care? (insurance coverage) • Was there a difference between the first generation Nepalese Immigrants and the younger generation in their health behaviors and perceived health status?
Methods • A convenience (nonrandom) sample of 110 Nepalese people completed the survey • The return rate for distributed surveys was 44% • Small incentive was offered to the people who filled out the survey. • The BRFSS (Behavior Risk Factor Surveillance System) from the CDC national health study was modified and pilot tested with local Nepalese people before the final distribution. • The survey contained 69 items and the Cronbach’s alpha reliability for the relationship scale was 0.82. • After the collection of the survey, SPSS PC version was used to analyze data.
Summary Results • A was a big difference between actual health status of people living in Nepal and the Unites States. • The perceived health status among Nepalese studied subjects was higher • There was no difference in smoking and drinking behaviors, however, exercise level was much higher among Nepalese people. • Despite relatively high rate of having health insurance coverage the screening for cancer was significantly lower. • Family’s needs and cultural values were perceived to be important • Perceptions about arranged marriage was mostly negative to neutral • The perceptions regarding dating relationship was different based on their marital status, single being more open to the dating activities. • Regarding homosexual relationship, more single people had positive attitudes than married people.
Conclusions • The unrepresentative sample, bigger sample is needed to get conclusive results • Although Nepalese immigrants seem to hold on to certain cultural beliefs, they seemed to change their attitudes about other issues such as marriage and dating. • Younger generation (single) were obviously more open than the older (married) people indicating some acculturation taking place among younger generation • Some critical health behaviors such as smoking, drinking, and most importantly yearly screening need to be changed. • Because of the item structure, the question about the prostate cancer screening could not be compared. • Education about health behaviors including smoking, alcohol use, yearly screening seems to be as critical to this population as for other groups.
Methodological Issues • Cultural Difference made the use of the same survey instrument (modified BRFS) difficult and often irrelevant (diet items, cast category, and violence). • Gender differences/roles may be the reason for the ability and willingness to answer questions that are viewed as inappropriate. • Sampling of convention attendees is skewed toward upper SES immigrants and specific ethnic/caste members. • It is extremely hard to get a representative sample as the actual number of total population could be very different from the census record. • Comparison between population living in Nepal and in the United States may show more clear picture about acculturation on family values
Next Steps/Modified qualitative methodology • Focus on Nepalese women first, and may be race, ethnicity or the cast categories should be considered. • With the focus groups- formulate questions that may illicit better information about lifestyle and health status. • Conduct interviews with individual men and women using qualitative interview techniques and analysis especially on the topic like violence then design the actual survey questions. • Conduct cross-checks with and among the focus groups after the data has been coded and analyzed.
Sources: • CDC, (2002). Behavioral Risk Factor Surveillance System, Retrieved at June, 2003, http://www.cdc.gov/brfss/brfsques.htm • Lantz PM, House JS, Lepkowski JM, Williams DR, Mero RP, Chen J. (1998) Socioeconomic factors, health behaviors, and mortality: results from a nationally representative prospective study of US adults. JAMA; 279(21) :1703-8. • PHS Task Force on Minority Health Data. (1992) Improving minority health statistics: report of the PHS Task Force on Minority Health Data. Washington, DC: Department of Health and Human Services, Public Health Service, Office of Minority Health. • Kramer, E.J., Kwong, K., Lee. E., and Chung, H. (2002). Cultural factors influencing the mental health of Asian Americans. West J Med. 176:227-231 • United States Department of State (2000). Diversity Immigrant Visa Program, Bureau of Consular Affairs, Washington DC) • http://www.nepalnews.com • http://www.WHO • http://www.census.gov
Nepal Total population (000), 2001 23,592 Annual population growth rate (%), 1991 to 2001 2.4 Dependency ratio (per 100), 2001 81 Dependency ratio (per 100), 1991 81 Percentage of population aged 60+ years, 2001 5.9 Percentage of population aged 60+ years, 1991 5.8 Total fertility rate, 2001 4.6 Total fertility rate, 1991 5.1 United States of America Total population (000), 2001 285,925 Annual population growth rate (%), 1991 to 2001 1.1 Dependency ratio (per 100) 2001 51 Dependency ratio (per 100), 1991 53 Percentage of population aged 60+ years, 2001 16.2 Percentage of population aged 60+ years, 1991 16.6 Total fertility rate, 2001 2.0 Total fertility rate, 1991 2.0 Population