Download
1 / 19
190 likes | 322 Views
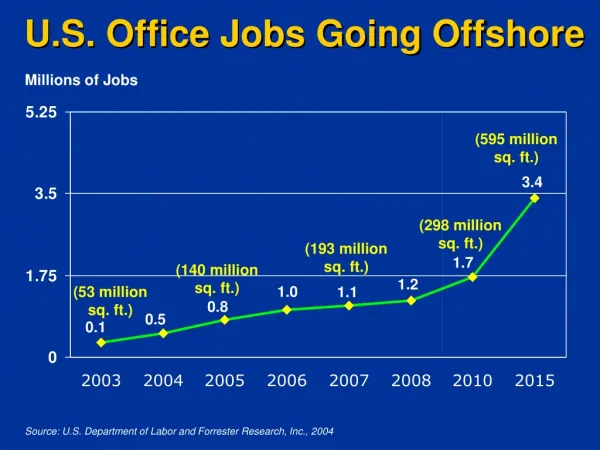
Wenling Li Exercise #2: Case Studies in Data Analysis (5 Ways to Make a Story out of Numbers). Real-Time Cities: an Introduction to Urban Cybernetics Harvard Design School: SCI 0646900 Spring 2014. Narrative Title. 1 |Census Dot Map. 2 | What do New Yorkers complain about?.

E N D
Wenling Li Exercise #2: Case Studies in Data Analysis (5 Ways to Make a Story out of Numbers) Real-Time Cities: an Introduction to Urban Cybernetics Harvard Design School: SCI 0646900 Spring 2014
Narrative Title 1 |Census Dot Map 2 | What do New Yorkers complain about? 3 | Energy consumption in the United Kingdom 4| Trash Track 5 | |US Debt Ceiling Visualized in $100 Bills
1 | Census Dot Map This is a map of every person counted by the 2010 US, 2011 Canadian, and 2010 Mexican censuses. The map has 454,064,098 dots - one for each person. Brandon Martin-Anderson, from the MIT Media Lab. wanted an image of human settlement patterns unmediated by proxies like city boundaries, arterial roads, state lines Project Website: http://bmander.com/dotmap/index.html
1 | Census Dot Map What is the raw data? US Census block-level population counts What processes are deployed to transform the raw data to information? ‘I wrote a python script to read each block from each shapefile and generate N dots uniformly throughout the shape, where N is the count of people in the block.’ And then Sort the dots to Generate tiles. And then show the tiles using the Google Maps API v3 What is the information that is the outcome of the aforementioned processes? an image of human settlement patterns unmediated by proxies like city boundaries, arterial roads, state lines
1 | Sensing the City How the act of sensing or access to raw data leads to comparison, judgment, reflection, reasoning, and abstraction? The existence of human at the block level and its density How the sum of all the above processes is resulting in a limited sort of agency for the data-driven construct? Which blocks are possible or agreeable for human to live without any intervene of proxies like city boundaries, arterial roads, state lines.
2 | What do New Yorkers complain about? Driven by a desire to visualize NYC's grievances on a city-wide scale, media artist DietmarOffenhuber — an alumnus of MIT's thoroughly awesome Media Lab — combed through public records in search of 311 calls (i.e. non-emergency service requests) made for noise, graffiti, and litter between 2010 and 2012. He then overlaid the results atop a block-by block, interactive map of the city's five boroughs, color-coding as he went according to the nature of each complaint. Project Website: http://offenhuber.net/what-do-new-yorkers-complain-about/
2 | What do New Yorkers complain about? Project Website: http://offenhuber.net/what-do-new-yorkers-complain-about/
What do New Yorkers complain about? What is the raw data? public records of 311 calls (i.e. non-emergency service requests) made for noise, graffiti, and litter between 2010 and 2012. What processes are deployed to transform the raw data to information? media artist DietmarOffenhuber — an alumnus of MIT's thoroughly awesome Media Lab — combed through public records in search of 311 calls (i.e. non-emergency service requests) made for noise, graffiti, and litter between 2010 and 2012. He then overlaid the results atop a block-by block, interactive map of the city's five boroughs, color-coding as he went according to the nature of each complaint. What is the information that is the outcome of the aforementioned processes? an image of urban dweller’s concerns and their distribution.
What do New Yorkers complain about? How the act of sensing or access to raw data leads to comparison, judgment, reflection, reasoning, and abstraction? It enable urban dwellers to understand the distribution and intensity of for noise, graffiti, and litter How the sum of all the above processes is resulting in a limited sort of agency for the data-driven construct? Where to live or not to live if you want avoid certain disturbance among for noise, graffiti, and litter; It also help the urban departments to locate the source and influence range of these disturbance
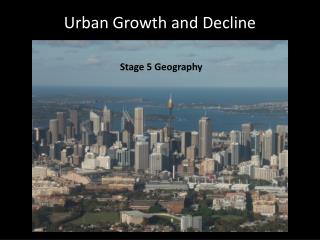
3 | Energy consumption in the United Kingdom Total energy consumption in the UK has fluctuated only slightly during the last four decades, however there have been gargantuan shifts in how we are using it and where it is sourced. Much of the media's attention has recently focused on the uptake of renewable energy, however in reality these changes are dwarfed by the enormous swings seen in other areas. The fall in industrial consumption and rise in other areas also helps to paint a picture of our society today. Project Website: http://visualizing.org/visualizations/energy-consumption-united-kingdom-million-tonnes-oil-equivalent-1970-2010
3 | Energy consumption in the United Kingdom What is the raw data? Department of Energy & Climate Change: the energy consumption statistics of different source, different sectors (industry, transport, domestic, service) in different years from 1970-2010 What processes are deployed to transform the raw data to information? Color coding and figurization. What is the information that is the outcome of the aforementioned processes? The total energy consumption and how we are using it and where it is sourced
3 | Energy consumption in the United Kingdom How the act of sensing or access to raw data leads to comparison, judgment, reflection, reasoning, and abstraction? Total energy consumption in the UK has fluctuated only slightly during the last four decades, however there have been gargantuan shifts in how we are using it and where it is sourced. How the sum of all the above processes is resulting in a limited sort of agency for the data-driven construct? Much of the media's attention has recently focused on the uptake of renewable energy, however in reality these changes are dwarfed by the enormous swings seen in other areas. The fall in industrial consumption and rise in other areas also helps to paint a picture of our society today.
4| Trash Track Over a period of 2 months, Trash Track [mit.edu] continuously tracked, and then visualized, the physical trajectories of hundreds of pieces of trash throughout the urban landscape. This research project at the MIT Media Lab SENSEable City Laboratory deployed a collection of small, smart, location aware 'tags', which are basically miniature sensors that can measure their physical location and report that data to a central server via the cellular network. Project Website:http://www.youtube.com/watch?feature=player_embedded&v=fvTZc5hWBNY
4| Trash Track Project Website:http://www.youtube.com/watch?feature=player_embedded&v=fvTZc5hWBNY
4| Trash Track What is the raw data? the physical trajectories of hundreds of pieces of trash throughout the urban landscape What processes are deployed to transform the raw data to information? Color coding and animation What is the information that is the outcome of the aforementioned processes? How hundreds of pieces of trash throughout the urban landscape, its source and its ending, the time taken in the journey.
4| Trash Track How the act of sensing or access to raw data leads to comparison, judgment, reflection, reasoning, and abstraction? The relationship between trash type and their ending, and the time taken to process them How the sum of all the above processes is resulting in a limited sort of agency for the data-driven construct? the research project is an investigation into understanding the 'removal-chain' in urban areas and to represents this as a type of change that is taking place in cities: a bottom-up approach to managing resources and promoting behavioral change through pervasive technologies.
5 |US Debt Ceiling Visualized in $100 Bills $114,500,000,000,000. - US unfunded liabilitiesTo the right you can see the pillar of cold hard $100 bills that dwarfs the WTC & Empire State Building - both at one point world's tallest buildings.Ifyou look carefully you can see the Statue of Liberty. Project Website:http://www.youtube.com/watch?v=iTBODoBaCns
5 |US Debt Ceiling Visualized in $100 Bills What is the raw data? A number. The U.S debt. What processes are deployed to transform the raw data to information? To materialize it into physicality of bills What is the information that is the outcome of the aforementioned processes? The physicality of the debt
5 |US Debt Ceiling Visualized in $100 Bills How the act of sensing or access to raw data leads to comparison, judgment, reflection, reasoning, and abstraction? Its volume and its weight compared to daily life items. How the sum of all the above processes is resulting in a limited sort of agency for the data-driven construct? "It is incumbent on every generation to pay its own debts as it goes. A principle which if acted on would save one-half the wars of the world." - Thomas Jefferson "This is when you need to remember that when a nation's economy collapses, the wealth of the nation doesn't disappear, it only changes hands."Government Waste: Missing Money Infographic does a great job showcasing the Trillions lost through miss-management.