Download

1 / 73
750 likes | 1.06k Views
Urban Growth and Decline. Stage 5 Geography. Cities are always changing. Urban decline. Urban renewal. Urban consolidation. Gentrification. Change involves four urban processes. Focus: ICT in the Stage 5 Geography Syllabus. Geography (Mandatory) Stage 5 requires students to:.

E N D
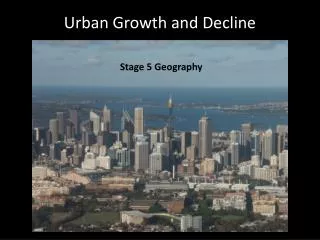
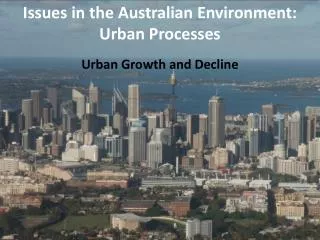
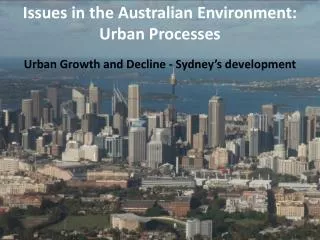
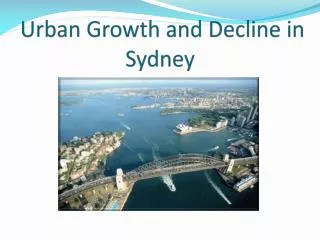
Urban Growth and Decline Stage 5 Geography
Cities are always changing Urban decline • Urban renewal Urban consolidation Gentrification Change involves four urban processes
Focus: ICT in the Stage 5 Geography Syllabus Geography (Mandatory) Stage 5 requires students to: • create a formatted, multiple-paged document containing web-links to communicate geographical information • design and create a simple database from student research • import data from other ICT applications into student research findings • design and create a multimedia presentation or webpage to communicate geographical information to a particular audience, including maps and diagrams as appropriate • critically analyse a website, including the ethics of the site • access, collect and interpret electronic information.
This action research project is to encourage students to: access, collect and interpret electronic information using the Internet, Moodle & SSC Leichhardt Geog Blog Import data from other ICT applications into student research findings review models, make notes and gather secondary data on urban structure and process. design and create a simple database from student research use ABS - Sydney a Social Atlas 2006,ABS Community profile statistics,Google Maps, Google Street View • Maintain a record of all materials studied in a formatted, multiple-paged document containing web-links to communicate geographical information
This action research project is to encourage students to: use applications ie. Word/Adobe Portfolio or OneNote • critically analyse a website, including the ethics of the site consult & add to a Delicious network using an agreed set of tags process information using applications such as Excel & Photoshop design & create a multimedia presentation or webpage to communicate geographical : Wiki
Implementation of the Program • Stage 1 – 31 March to 2 May • Stage 2 – 3 May to 23 May • Stage 3 – 24 May onwards
The Research Questions How is the Foreshore being used? How has the land use changed and what is the impact on the biophysical and built environment? What issues have arisen from Urban Growth & Decline? Who is affected by these issues? How are the issues being addressed?
The Research Cycle 1. Identify the aim/purpose of the investigation 9. Where appropriate, take action 2. Generate focus questions to Guide the investigation 8. Propose individual or group action in response to the findings 3. Which primary and secondary data are needed to answer the focus questions 7. Select methods to effectively communicate the research findings 4. Identify the techniques that will be used to collect the data 6. Process and analyse the data collected 5. collect primary and secondary data
The Field Study Area Millers Point Walsh Bay Barangaroo Circular Quay Darling Harbour
Basic content presented in 7 PowerPoints 1. Basic urban processes 2. Sydney’s Development 3. Government stakeholders and their responsibilities 4. Community and commercial stakeholders 5. Changes in the study area from the 19th to 21st centuries 6. Field Work 7. Processes operating in the study area
Lesson content provided students with a rich preparation for field activities Hickson Rd – The Hungry Mile – Darling Harbour
Showing Change in the Area • Smith & Gardiner’s Map of Sydney and Suburbs 1855
Showing Change in the area • Robinson’s Aeroplane Map of Sydney 1922
Showing Change in the Area • Google Map of Sydney • 2010
Moodle : supplementing basic content A platform of resources OneNote book template Link to TALE & laptop Wraps Homework posted here
SSC Geog Blog Providing additional content Aiming to facilitate interactivity
SSC Geog Blog Provide a additional audio materials Pages added for each part of course
SSC Geog Blog PowerPoints posted on Blog
ABS Sydney a Social Atlas 2006 • ABS Community profile statistics • Google Maps & Street View • Models of Urban development • Excel, Word, Adobe Portfolio or OneNote, Photoshop, Camera • Delicious • SSC Leichhardt Blog Stage 1 – Resources and Tools • Digital Tools • Simple Land Use Models • Web2.0 Tools
Sydney has changed since 1788 Sydney has grown out from a centre
Cities can be represented by circles The area of first settlement Cities grow out from areas of first settlement, and as they grow certain processes occur: Some areas Decline In some areas there is Renewal Outward growth There’s Consolidation of people in some places In other places change in social and economic status occurs - Gentrification
Sydney has branched out What might have caused this?
George St, 1950s Trams began to be phased out from the 1950s onwards as car and truck transport developed
Car & Trucks and Buses By the 1960s cars, trucks and buses were major forms of transport in Sydney
Lessons: provided basic content Visible air pollution Waterfront cargo storage Port Activities Major traffic thoroughfare Horse drawn freezer/meat van Cargo unloaded directly to wharf Pyrmont bridge: 1903
Lessons: provided basic content No visible air pollution Waterfront Hotels & apartments Port activities confined to ferries and Private boating Tourism activities on wharf Pyrmont bridge: 2009
View across Darling Harbour 2010 Can you see anything from the 1880s?
Living and Working Conditions Walsh Bay Wharves Warehouse 19 Gloucester Street, The Rocks Wool Store Port and factory workers lived close to work Late 19th century view from Windmill St, Millers Point, looking over Walsh Bay
Living and Working Conditions Millers Point 19 Gloucester Street, The Rocks Coal powered steam engine Coal train rolling stock Early 20th century Darling Harbour coal loader – ships needed coal for fuel
Living and Working Conditions Horse and cart Unsealed streets and horse manure a breeding ground for bacteria Children barefooted Urban decline in the 19th century
Living and Working Conditions 19 Gloucester Street, The Rocks Hydrated lime barrel. Hydrated lime was used as a disinfectant because it produced a dry & alkaline environment that retard bacterial growth In the 19th Century streets were often unsealed and unsanitary
Living and Working Conditions 19 Gloucester Street, The Rocks Blocked drainage being cleared Bones, horns and old piles unearthed Urban renewal – cleaning out 19th century drains in 1900
Living and Working Conditions 1900 Demolition of sub-standard housing 19 Gloucester Street, The Rocks A bubonic plague outbreak led to demolition of some decaying urban areas
Living and Working Conditions 19 Gloucester Street, The Rocks Signs of global industry emerging Around 1900 retailing was still largely through corner stores and local businesses
Living and Working Conditions Pyrmont Balmain 19 Gloucester Street, The Rocks Walsh Bay finger wharves Large areas of housing demolished to build the Sydney Harbour bridge Darling Harbour In the 20th century the area was still a mix of docks, warehouses, industry & housing
Living and Working Conditions 19 Gloucester Street, The Rocks Still a working port Railway lines removed Urban decline – old industrial area Empty Wool Stores Now converted to apartments & parking Darling Harbour immediately before the Darling Harbour Urban renewal Project - 1980
How is land in the study area now used? High rise office blocks Western Distributor Modern apartments – urban consolidation Millers Point heritage houses built from 1820 to 1930 Heritage buildings remaining on Gas Works site No shipping of cargo, Port abandoned
How is land in the study area now used? Low energy buildings with small carbon footprint Tourist Hotels Restaurants and bars Moorings for private ferries, cruise and charter boats No longer finger wharves at King St
How is land in the study area now used? Urban consolidation Urban Renewal - Maritime Museum Public Access to foreshore
Excel, Word, Adobe Portfolio or OneNote, Photoshop, Camera • Government, Corporate and Community websites & reports • Images – photos, videos, maps, statistical maps, graphs Stage 2 – Resources and Tools • Digital Tools • Delicious • SSC Leichhardt Blog • Processes, Stakeholders, Decisions, Future • Web2.0 Tools