Download
1 / 11
110 likes | 244 Views
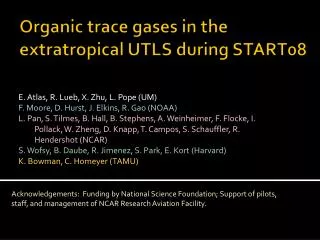
Transport timescales and source regions of UTLS air from START08. E. Ray, F. Moore and K. Rosenlof NOAA/ESRL and CU/CIRES Thanks to UCATS and PANTHER instrument teams, L. Pan, K. Bowman, G. Dutton, J. Pittman. Introduction.

E N D
Transport timescales and source regions of UTLS air from START08 E. Ray, F. Moore and K. Rosenlof NOAA/ESRL and CU/CIRES Thanks to UCATS and PANTHER instrument teams, L. Pan, K. Bowman, G. Dutton, J. Pittman
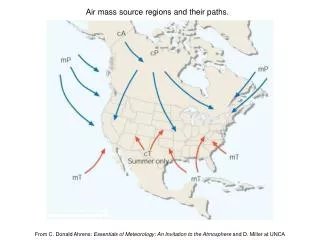
Introduction UT/LS region is a complex mixture of air transported over many different time scales and from different regions. “Highpaths” Goal of this work: Use in situ trace gas measurements from START08 and surface stations to determine transport time scales and source regions of air in the extratropical UT/LS. “Lowpaths” START08 flights NOAA GMD surface measurements
In Situ Surface Observations N2O F12 F11 START08 trop data “Age” tracers – can determine transport time scales and surface latitude origins, once “highpath” part has been removed. Photolytic tracers – sensitive to where the air has been - “highpath” tracers h1211 SF6 CO2
Photolytic Tracers and the Stratospheric Circulation Near complete loss Local Transport Time (≈ months) Negligible loss The photolytic tracers are sensitive to changes in the maximum path height of an air parcel and each tracer is sensitive to a different height.
Stratospheric Fractions From Photolytic Tracer Correlations Any decrease in a photolytic tracer is due to mixing from above the cutoff level, where the mixing ratio is zero, with surface values. Cutoff level Define the fraction of air from aboveF11cutoff level by: START08 LS START08 UT NOAA Surface
Stratospheric Fraction Profiles N2O cutoff F12 cutoff F11 cutoff H1211 cutoff Extratropical UT air contains a mixture of 4-10% air from above 100 hPa and 0.5-2% from above 10 hPa.
Removing “High Path” Part of UTLS Age Tracers (Engel et al., 2009) where i = cutoff level in pressure cG(i) = mixing ratio of tracer with mean age G(i). F(i) = fraction of air from above level i From cUTLS we can compute transport times and surface latitude origins for the part of the air in the UTLS that did not go above 100 hPa.
“Low Path” Transport Time From Surface to LMS Low upper strat fractions from trop intrusions have transport times at least several months shorter thanaverageat this level – “shortcut” to LMS. 8 4 Approximate Altitude Diff (km) Region with a minimum of low transport times coincident with the level of the jet core. Shortest transport times in ExTL. 0 The transport time is calculated from the time difference between the flight date and the date where csurface(lat=0) =cUTLS. Average values up to 70 K are consistent with Boenisch et al, 2009. Values are cutoff at a minimum of 1 month by adjusting the surface latitude origin.
Surface Latitude Origins of Transport Times < 1 Month More NH surface influence on ExTL – consistent with more local troposphere mixing into ExTL.
Surface Latitude Origins of Tropospheric Part of UT Air • Primarily subtropical influence from the surface on the extratropical UT. • Surface latitude origin distribution closely matches the Elat distribution. • Method loses sensitivity north of 40N due to lack of SF6 surface gradient.
Conclusions • START08 dataset is unique and valuable for studying the origins of air transported into the extratropical UTLS. • The combination of photolytic and age tracers allows a detailed description of the composition of UTLS air including pathways, time scales and surface latitudinal origins. • Profiles of stratospheric fractions in UTLS could be a useful diagnostic for model transport evaluation. • More to come by including CO2 and other tracers and especially the HIPPO dataset.