Download
1 / 14
140 likes | 237 Views
Learn about the challenges and components of estimating soil carbon inventory, focusing on management impacts and model uncertainties. Discover how national-level data sources and point-based surveys are integrated to address uncertainties in agricultural soil carbon estimates.

E N D
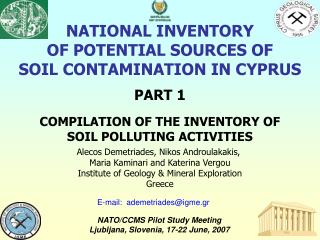
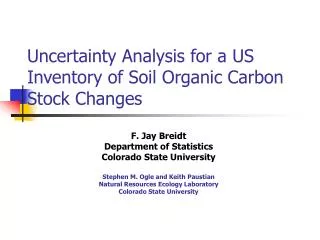
Uncertainty in national-scale soil C inventory estimates Keith Paustian1,2, Stephen Ogle2, Jay Breidt3 1Dept of Soil and Crop Sciences, Colorado State Univ. 2Natural Resource Ecology Lab, Colorado State Univ. 3Dept. of Statistics, Colorado State Univ.
Uncertainty – the policy context • Inventory reporting increasingly focusing on uncertainty • Policy – all about setting priorities, e.g. GHG mitigation strategies • Large potential, low uncertainty – policy actions, investment $$$ • Large potential, high uncertainty – R&D $$$ (maybe) • Small potential – good luck!
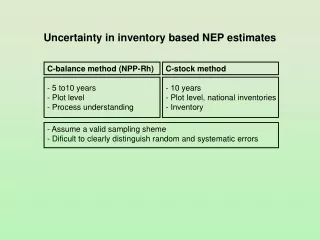
Special challenges for soil C estimation • Management hugely important in determining rates and trajectories of SOC change – good data on spatial/temporal management trends is often lacking • Soil stocks have large ‘inertia’ – dependencies on long-term previous LU & mgmt history • Soil C measurement data relatively sparse – essentially no ‘designed’ remeasurement inventory systems at national scale
Uncertainty components addressed in US agricultural soil C estimates • Management inputs (levels of fertilization, tillage, manuring) • Model structure/parameter uncertainty • Initial conditions and land use history • Upscaling of inventory point data to national-scale
Bottom-up modeling framework Environmental Conditions Model Inputs Database Management Activity Point Scale Data (NRI Survey) PDF Results Database Structural Uncertainty Estimator Database Management Run Control Simulation Model: Century
Data sources • National Resource Inventory (NRI) • Statistically-based sample of ca. 800,000 points since 1979 • LU, soils, crop rotations/vegetation • Most land management practices were NOT collected in NRI (but new data since 2003) • County-, state- and regional survey data of management practices • E.g. tillage, fertilization, manuring, irrigation • Regional-level LU practices (pre-1980)
Johnson County, IA 563 points Note: spatial references shown are approximate US National Resources Inventory (NRI): Point-Based Survey Data Source: US Dept. of Agriculture
Tillage Practices (CTIC) Mineral N Fertilization (USDA-ERS) Manure Amendments (USDA and EPA) PDF PDF PDF Integrating survey with point data Johnson County, IA Monte Carlo Analysis
Model Structural Uncertainty • Model algorithms, parameterization and measurement error • Empirically-Based Approached • Simulate management impacts on SOC storage for experimental sites • ca. 50 sites with over 800 management treatment observations • Linear mixed effect models
Model Structural Uncertainty • Fixed effects (βX) include both categorical (e.g. type of system, tillage practice) and continuous (e.g. temperature, precipitation, clay content) variables • Random effects (γ) account for spatiotemporal dependencies in experimental data (thus incorporates scale-dependencies in uncertainties) • Adjusts for biases and provides estimates of uncertainty
Totals for US Croplands (1990s) 1990-1994: -62.0 ± 22% Tg CO2 eq. yr-1 1995-2000: -64.0 ± 16% Tg CO2 eq. yr-1
-1.17 ± 644% tonnes CO2 eq. ha-1 yr-1 -0.61 ± 525% tonnes CO2 eq. ha-1 yr-1 X X -1.12 ± 49% Tg CO2 eq. yr-1 -0.59 ± 45% Tg CO2 eq. yr-1 USDA Major Land Resource Areas (MLRAs)
Using Enhanced Vegetation Index to Improve Estimation of Crop Production (NASA-CASA model) Developing a national measurement network to refine uncertainty analysis (3000-5000 sites) Reducing Uncertainties