Download
1 / 10
100 likes | 227 Views
VR Matching This presentation illustrates the VR Matching sub-module of Vector Raptor. Data Analysis: Two ASML FOCAL Datasets Both: 2419 resist 1 st dataset with 24 mj center dos, Post Reticle & RS clean 2 nd dataset, 24mj center dos Post RS clean. Approach to the analysis.

E N D
VR MatchingThis presentation illustrates the VR Matching sub-module of Vector Raptor Data Analysis: Two ASML FOCAL Datasets Both: 2419 resist 1st dataset with 24 mj center dos, Post Reticle & RS clean 2nd dataset, 24mj center dos Post RS clean
Approach to the analysis This is FOCAL data taken from an ASML/FOC_1400_300WN_R6 generation tool Two FOCAL datasets were measured. (originally in “tlg” format) The first was taken after a reticle & stage cleaning The reticle stage was cleaned a 2nd time after the first data was examined.
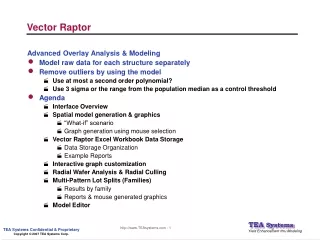
VR Matching Interface • Plot Selection: • Vector • Contour • Radial • Horizontal XY • Vertical XY • Mouse Commands: • Graph Editor • Cull data points • Cull wafers • Plot/Display data from boxed area • Copy area to clipboard InterField Precision data INTRAField Focus Data “Best Focus”
Variable control • Select data to plot/display from “Features” combo • With this data we can choose vector, dz-H, dz-V or dz • dz=(H+V)/2 for focus data • Can be overlay, focus, film or CD data • Select Family of data • Here it is based on the precision or full field data points • Select wafers to use • Data culling by variable name • Select variable • Press “Variable” to display a histogram of the variable • Includes only points in range • Min<Points<Max • Plotted here is a 1-D vector plot (not contour) of the InterField precision focus and the IntraField focus uniformity Data cull by variable
Vector Graph for dz-V (= “x focus” or vertical line focus) • Scales are set to same level • InterField focus variation has shifted to lower values in the 2nd dataset • Focus profile of IntraField data has changed • Graph along X axis shows • focus has shifted down for 2nd dataset • C1 to C2 feature-family split is less • Variation across field is greater
Focus for dz-H (Horizontal line, Y-Focus) 1st DataSet 2nd DataSet
InterField Variation of Focus 1st DataSet 2nd DataSet
IntraField Focus uniformity 1st DataSet 2nd DataSet • 2nd cleaning of stage did not really help. • 1st dataset end-columns of field provided greatest variation in focus
IntraField with 5% & 95% Population Confidence • Graph editor added in the BoxPlot confidence intervals