Benchmarking vs. Performance Improvement Indicators
Benchmarking vs. Performance Improvement Indicators. Benchmarking. Benchmarking is the process of comparing one's processes and performance metrics to industry bests or best practices Benchmarks are global overarching goals, expectations, or outcomes

Benchmarking vs. Performance Improvement Indicators
E N D
Presentation Transcript
Benchmarking • Benchmarking is the process of comparing one's processes and performance metrics to industry bests or best practices • Benchmarks are global overarching goals, expectations, or outcomes • future goals extrapolated from the internal practices; goal setting which is internally focused can’t be true reflection of customer’s expectations (only looking at your practice not compared to others)
Benchmarking • Bench marking is time and cost efficient because it involves imitation and adaptation rather than pure invention. Prevents the “Re-inventing the wheel” • An effective ‘wake-up call’ and helps to make a strong case for change • Practical ways in which step changes in performance can be achieved by learning from others who have already undertaken comparable changes • The impetus for seeking new ways of doing things and promotes a culture that is receptive to fresh approaches and ideas • Opportunities for staff to learn new skills and be involved in the transformation process from the outset
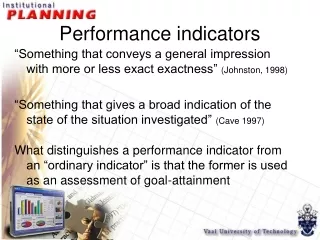
Performance Improvement Indicators • A performance indicator is a type of performance measurement • Performance measurement is the process of collecting, analyzing and/or reporting information regarding the performance • Indicators are those tasks or outputs that characterize the benchmark. Indicators identify actions or capacities within the benchmark. Indicators are the measurable components of a benchmark such as comparison or a measurement and are an output measure
How to Benchmark • 1.Select subject • 2.Define the process • 3.Identify potential partners • 4.Identify data sources • 5.Collect data and select partners • 6.Determine the gap • 7.Establish process differences • 8.Target future performance • 9.Communicate • 10.Adjust goal • 11.Implement • 12.Review and recalibrate
Benchmarking • American College of Surgeons (ACS) • National Trauma Data Bank (NTDB) benchmarks facilities and data • National Association of State EMS Officials(NASEMSO) looking at benchmarking State-to-State • Data that makes sense to improve care and patient outcomes • Compare like sized facilities against each other in the State and in their Region • Make the data more useful, meaningful to improve patient outcomes • Needed to change what we were doing at State with implementation of the web-based product
ED dwell times >2 hours with ISS >15 • Are facilities getting the moderately to severely injured out of the ED in 2 hours or less • Long held belief that relates to so-called “golden hour.” Patients who receive definitive care promptly do better • Wake Forrest did a study of trauma patients with ED dwell times excluding patients taken to OR from the ED: • They looked at the impact of ED dwell time on in-hospital mortality, length of stay and ventilator days
ED Dwell time • Overall mortality was 7%, and the average time in the ED was 3 hours and 15 minutes • They set an arbitrary number of 2 hours for an ED dwell time • When they looked at their numbers, they found that mortality increased (7.8% vs 4.3%) and that hospital and ICU lengths of stay were longer in the longer ED stay group. Hospital mortality increased with each hour spent in the ED, and 8.3% of patients staying between 4 and 5 hours dying • Patients staying longer in the ED between 2 and 5 hours were more badly injured but not more physiologically abnormal. This suggests that diagnostic studies or consultations were being performed.
ED dwell time • The Montana Field Trauma Decision Scheme/Trauma Team Activation Criteria came out in 2010 • Used the physiological criteria for determining if patients met criteria but didn’t get an activation
No Trauma Team but met Activation Criteria • Look at Under triage (followed closely by ACS reviewers) • Under triage is bad because patients who have serious injuries are not met by the full trauma team, and would benefit from the extra manpower and speed possible with an activation (found to affect morbidity and mortality) • The most common causes for under triage are: • •Failure to apply activation criteria • •Criteria are too numerous or confusing • •Injuries or mechanism information is missed or underappreciated
Other ideas for performance Indicators • GCS <=8 with no intubation or rescue airway • Hemo/pneumothorax with no chest tube • Transfers out of state • Transfers after admission