Sampling and Occupancy Estimation
Sampling and Occupancy Estimation. Krishna Pacifici Department of Applied Ecology NCSU January 10, 2014. Designing studies. Why, what, and how? Why collect the data? What type of data to collect? How should the data be collected in the field and then analyzed?


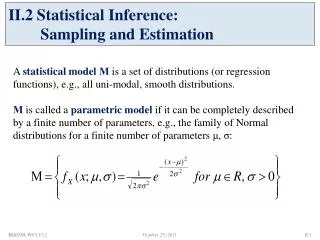
Sampling and Occupancy Estimation
E N D
Presentation Transcript
Sampling and Occupancy Estimation Krishna Pacifici Department of Applied Ecology NCSU January 10, 2014
Designing studies • Why, what, and how? • Why collect the data? • What type of data to collect? • How should the data be collected in the field and then analyzed? • Clear objectives help relate all three components.
Why?Clear objectives • How will the data be used to discriminate between scientific hypotheses about a system? • How the data will be used to make management decisions? • For example: • Determine overall level of occupancy for a species in particular region. • Compare the level of occupancy in two different habitat types within that region.
What?Many kinds of data • Population-level • Population size/density • Survival • Immigration & emigration • Presence/absence • Community-level • Persistence • Colonization & extinction • Species richness/diversity
How?Sampling and Modeling • Interest lies in making inference from a sample to a population • Statistics! • Want it to be repeatable and accurate • Others should understand what you have done and be able to replicate • Many different modeling/analysis approaches • Distance sampling, multiple observer, capture-recapture, occupancy modeling…
PURPOSES OF SAMPLING • ESTIMATE ATTRIBUTES (PARAMETERS) • Abundance/ density • Survival • Occurrence probability • ALLOW LEGITIMATE EXTRAPOLATION FROM DATA TO POPULATIONS • PROVIDE MEASURES OF STATISTICAL RELIABILITY
SAMPLING NEEDS TO BE • ACCURATE– LEADING TO UNBIASED ESTIMATES • REPEATABLE– ESTIMATES LEAD TO SIMILAR ANSWERS • EFFICIENT– DO NOT WASTE RESOURCES
BIAS • HOW GOOD “ON AVERAGE” AN ESTIMATE IS • CANNOT TELL FROM A SINGLE SAMPLE • DEPENDS ON SAMPLING DESIGN, ESTIMATOR, AND ASSUMPTIONS
UNBIASED TRUE VALUE SAMPLE ESTIMATE * * * * * * * * AVERAGE ESTIMATE
BIASED TRUE VALUE SAMPLE ESTIMATE * * * * * * * * BIAS AVERAGE ESTIMATE
REPEATABLE (PRECISE) SAMPLE ESTIMATE * * * * * * * *
NOT REPEATABLE (IMPRECISE) * * * SAMPLE ESTIMATE * * * * *
CAN BE IMPRECISE BUT UNBIASED.. OR * AVERAGE ESTIMATE * * SAMPLE ESTIMATE * * * * * TRUE VALUE
PRECISELY BIASED..OR TRUE VALUE SAMPLE ESTIMATE * * * * * * * * AVERAGE ESTIMATE
IMPRECISE AND BIASED! AVERAGE ESTIMATE * * SAMPLE ESTIMATE * * * * * TRUE VALUE *
ACCURATE=UNBIASED & PRECISE TRUE VALUE SAMPLE ESTIMATE * * * * * * * * AVERAGE ESTIMATE
HOW DO WE MAKE ESTIMATES ACCURATE ? • KEEP BIAS LOW • SAMPLE TO ADEQUATELY REPRESENT POPULATION • ACCOUNT FOR DETECTION • KEEP VARIANCE LOW • REPLICATION (ADEQUATE SAMPLE SIZE) • STRATIFICATION, RECORDING OF COVARIATES, BLOCKING
Key Issues • Spatial sampling • Proper consideration and incorporation of detectability
Sampling principles • What is the objective? • What is the target population? • What are the appropriate sampling units? • Size, shape, placement • Quantities measured
Remember • Field sampling must be representative of the population of inference • Incomplete detection MUST be accounted for in sampling and estimation
Example- Transect sampling to count snakes in Corbett National Park, India
What is the objective? • Unbiased estimate of population density of snakes (e.g., cobras) on Corbett National Park • Coefficient of variation of estimate < 20% • As cost efficient as possible
What are the appropriate sampling units? • Quadrats? • Point samples? • Line transects?
Nonrandom placement • Advantages • Easy to lay out • More convenient to sample • Disadvantage • Do not represent other (off road) habitats • Road may attract (or repel) snakes
Random placement • Advantages • Valid statistical design • Represents study area • Replication allows variance estimation • Disadvantage • May be logistically difficult • Harder to lay out • May not work well in heterogeneous study areas
Stratified sampling • Advantages • Controls for heterogeneous study area • Allows estimation of density by strata • More precise estimate of overall density • Disadvantages • More complex design • May require larger total sample
Are these hard “rules” –NO! • Some violations of assumptions can be OK – and even necessary (idea of “robustness”) • These are ideals to strive toward • Good if you can achieve them • If you can’t, you can’t– but study results may need different interpretation
Estimation: from Count Data to Population (I) • Geographic variation (can’t look everywhere) • Frequently counts/observations cannot be conducted over entire area of interest • Proper inference requires a spatial sampling design that permits inference about entire area, based on a sample
A valid sampling design • Allows valid probability inference about the population • Statistical model • Allows estimates of precision • Replication, independence
Other Spatial Sampling Designs • Systematic sampling • Can approximate random sampling in some cases • Cluster sampling • When the biological units come in clusters • Double sampling • Very useful for detection calibration • Adaptive sampling • More efficient when populations are distributed “clumpily” • Dual-frame sampling
Estimation: from Count to Population (II) • Detectability (can’t see everything in places where you do look) • Counts represent some unknown fraction of animals in sampled area • Proper inference requires information on detection probability
Sampling Take Home Messages • Field sampling must be designed to meet study or conservation objectives • Field sampling must be representative of the population of inference • Incomplete detection MUST be accounted for in sampling and estimation
Occupancy Estimation • Species status = present or absent • Coarse measure of population status • Proportion of occupied patches • Data can be collected efficiently over large spatial and temporal extents • Species and community-level dynamics
Occupancy Estimation: Uses • Surveys of geographic range • Habitat relationships • Metapopulation dynamics • Observed colonization and extinction • Extensive monitoring programs: 'trends' or changes in occupancy over time
Species Occurrence • Conduct “presence-absence” (detection-nondetection) surveys. • Estimate what fraction of sites (or area) is occupied by a species when species is not always detected with certainty, even when present (p < 1). • ‘Site’: Arbitrarily defined spatial unit (forest patch of a specified size) or discrete naturally occurring sampling units (ponds).
Site occupancy: A solution • MacKenzie et al. 2002 (Ecology) • Key design issues: Replication • Temporal replication: repeat visits to sample units • Replicate visits occur within a relatively short period of time (e.g., a breeding season) • Spatial replication: randomly selected ‘sites’ or sample units within area of interest
Basic Sampling Scheme:Single Season • s sites are surveyed, each at k distinct sampling occasions. • Species is detected/not detected at each occasion.
Necessary information: Data summary → Detection histories • Detection history: Record for each visited site or sample unit • 1 denotes detection • 0 denotes nondetection • Example detection history: hi = 1 0 0 1 0 • Denotes 5 visits to the site • Target species detected during visits 1 and 4 • 0 does not necessarily mean the species was absent • Not detected, but could be there!
Model Parameters: Single-Season Models -probability site i is occupied. pij -probability of detecting the species in site i at time j, given species is present.
Model assumptions • Sites are closed to changes in occupancy state between sampling occasions • No heterogeneity that cannot be explained by covariates • The detection process is independent at each site • > 500 meters apart