Download
1 / 26
390 likes | 1.01k Views
Point Estimation of Parameters and Sampling Distributions. Outlines: Sampling Distributions and the central limit theorem Point estimation Methods of point estimation Moments Maximum Likelihood. Sampling Distributions and the central limit theorem. Random Sample

E N D
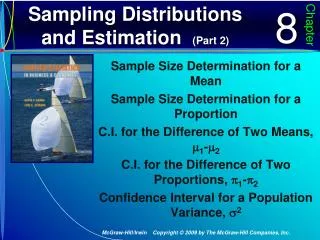
Point Estimation of Parameters and Sampling Distributions Outlines: • Sampling Distributions and the central limit theorem • Point estimation • Methods of point estimation • Moments • Maximum Likelihood
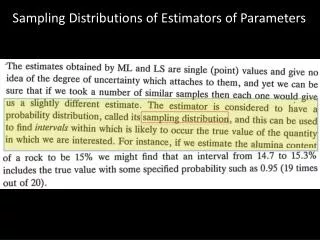
Sampling Distributions and the central limit theorem • Random Sample • Sampling distribution: the probability distribution of a statistic. • Ex. The probability distribution of is called distribution of the mean.
Sampling Distributions of sample mean • Consider the sampling distribution of the sample mean. • Xi is a normal and independent probability, then
Central limit theorem • n >= 30, sampling from an unknown population => the sampling distribution of will be approximated as normal with mean µ and 2/n.
Central limit theorem • Ex. Suppose that a random variable X has a continuous uniform distribution • Find the distribution of the sample mean of a random sample of size n=40 • Method: 1.Calculate the value of mean and variance of x 2. x 4 5 6
Sampling Distribution of a Difference • Two independent populations. • Suppose that both populations are normally distributed. • Then, the sampling distribution of is normal with µ1 ,12 µ2 ,22
Sampling Distribution of a Difference • Definition
Sampling Distribution of a Difference • Ex. The effective life of a jet-turbine aircraft engine is a random variable with mean 5000 hr. and sd. 40 hr. The distribution of effective life is fairly close to a normal distribution. The engine manufacturer introduces an improvement into the manufacturing process for the engine that increases the mean life to 5050 hr. and decrease sd. to 30 hr. • 16 components are sampling from the old process. • 25 components are sampling from the improve process. • What is the probability that the difference in the two sample means is at least 25 hr?
Point estimation • Parameter Estimation: calculation of a reasonable number that can explains the characteristic of population. • Ex. X is normally distributed with unknown mean µ. • The Sample mean( ) is a point estimator of population mean (µ) => • After selecting the sample, is the point estimate of µ.
Point estimation • Unbiased Estimators
Point estimation Ex. Suppose that X is a random variable with mean μ and variance σ2 . Let X1,X2 ,..., Xnbe a random sample of size n from the population. Show that the sample mean and sample variance S2are unbiased estimators of μand σ2 , respectively. • proof, • proof,
Point estimation • Sometimes, there are several unbiased estimators of the sample population parameter. • Ex.Suppose we take a random sample of size n from a normal population and obtain the data x1 = 12.8, x2 = 9.4, x3 = 8.7, x4 = 11.6, x5 = 13.1, x6 = 9.8, x7 = 14.1,x8 = 8.5, x9 = 12.1, x10 = 10.3. all of them are unbiased estimator of μ
Point estimation • Minimum Variance Unbiased Estimator (MVUE)
Point estimation • MVUE for μ
Method of Point Estimation • Method of Moment • Method of Maximum Likelihood • Bayesian Estimation of Parameter
Method of Moments • The general idea of the method of moments is to equate the population moments to the corresponding sample moments. • The first population moment is E(X)=μ........(1) • The first sample moment is ........(2) • Equating (1) and (2), • The sample mean is the moment estimator of the population mean
Method of Moments • Moment Estimators Ex.Suppose that X1,X2 ,..., Xnbe a random sample from an exponential distribution with parameter λ. Find the moment estimator of λ There is one parameter to estimate, so we must equate first population moment to first sample moment. first population moment = E(X)=1/λ, first sample moment =
Method of Moments Ex. Suppose that X1,X2 ,..., Xnbe a random sample from a normal distribution with parameter μ and σ2. Find the moment estimators of μ and σ2. For μ: k=1; The first population moment is E(X)=μ........(1) The first sample moment is ........(2) Equating (1) and (2), For σ2: k=2; The second population moment is E(X2)=μ2+σ2......(3) The second sample moment is ......(4) Equating (3) and (4),
Method of Maximum Likelihood • Concept: the estimator will be the value of the parameter that maximizes the likelihood function.
Method of Maximum Likelihood Ex. Let X be a Bernoulli random variable. The probability mass function is
Method of Maximum Likelihood Ex. Let X be normally distributed with unknown μ and known σ2. Find the maximum likelihood estimator of μ
Method of Maximum Likelihood Ex. Let X be exponentially distributed with parameter λ. Find the maximum likelihood estimator of λ.
Method of Maximum Likelihood Ex. Let X be normally distributed with unknown μ and unknown σ2. Find the maximum likelihood estimator of μ, and σ2.
Method of Maximum Likelihood • The method of maximum likelihood is often the estimation method that mathematical statisticians prefer, because it is usually easy to use and produces estimators with good statistical properties.