Download
1 / 12
120 likes | 215 Views
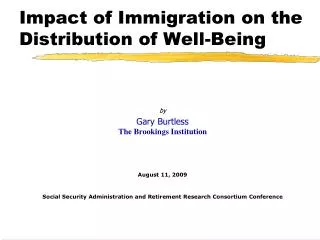
This study by Gary Burtless at The Brookings Institution in 2009 analyzes the impact of immigration on income and wage distributions from 1850 to 2007. It explores how immigration affects well-being through factors like average wage, income, and age profiles. By looking at the changes in immigration policies and their effects on wages and incomes, the research shows how reducing immigration can influence the economy and residents' well-being.

E N D
Impact of Immigration on the Distribution of Well-Being by Gary Burtless The Brookings Institution August 11, 2009 Social Security Administration and Retirement Research Consortium Conference
Number (millions) and percent foreign born, 1850-2007 Source: Census Bureau.
Immigration and the income and wage distributions • Historically high rates of immigration • Major differences between immigrants and current residents • Age distribution • Skill mix • Direct impact on distribution of well-being • Average wage • Average income • Age-profile of income
Immigration and the income and wage distributions • Ignore feedback effects on natives’ wages • Use March CPS / ASEC files to estimate trends in wages, incomes ifthere were fewer immigrants • Identification of immigrants, year of entry • YEARS: 1993-2007 • POLICY CHANGE: 1980 • Doubtful identification of adult children of post-1979 immigrants
Post-1979 immigrants in the U.S. wage distribution, 1993-2007 Share = 13.3% Share = 10.6% Share = 5.8% Source: Tabulations of 1994, 2001, and 2008 ASEC files.
Average Annual Wage by Immigrant Status and Year of Entry into the U.S., 1993 - 2007 19% 26% Source: Tabulations of 1994 - 2008 ASEC files.
Impact of Reduced Immigration after 1979 on Level of Economy-Wide Average U.S. Wage, 1980-2007 Source: Tabulations of 1994 - 2008 ASEC files.
Impact of Post-1979 Immigration on Average Size-Adjusted Personal Income, 1993 - 2007 -2.0% -3.2% Source: Tabulations of 1994 - 2008 ASEC files.
Impact of selected changes in immigration policy on median size-adjusted personal income, 1993-2007 Percent of median size-adjusted income in indicated year +1.8% +1.7% +1.1% +1.0% Source: Tabulations of 1994, 2001, and 2008 ASEC files.
Increase in size-adjusted average income resulting from 20% cut in immigration after 1979: IMPACT ON AGE PROFILE OF INCOME (2006)
Increase in size-adjusted average income resulting from reduced immigration after 1979:IMPACT of ALTERNATIVE POLICIES (2006) 50% CUT IN MEXICAN IMMIGRATION 50% CUT IN DROPOUTS 20% OVERALL CUT
Immigration and well-being • Reduced immigration would -- • Raise average wage of remaining population • Produce faster growth in initial social security benefits • Increase residents’ average income • Boost the relative incomes of residents who are members of households headed by younger adults • These conclusions ignore spillover effects of lower immigrant labor supply on prices and on natives’ employment and wages