Download

1 / 16
160 likes | 268 Views
Great Miami Loramie Creek. Great Miami and Loramie Creek. By: Kathryn Reed, Sarah Ambach, and Xiaojing Wu. By: Kathryn Reed, Xiaojing Wu, and Sarah Ambach. Location. Located in Western Ohio Mainly in Miami and Shelby Counties City of Dayton is at southern tip of watershed. Background info.

E N D
Great Miami Loramie Creek Great Miami and Loramie Creek By: Kathryn Reed, Sarah Ambach, and Xiaojing Wu By: Kathryn Reed, Xiaojing Wu, and Sarah Ambach
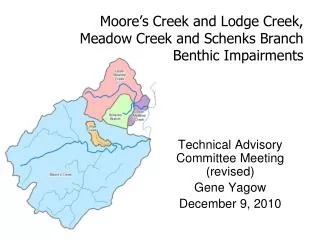
Location • Located in Western Ohio • Mainly in Miami and Shelby Counties • City of Dayton is at southern tip of watershed
Background info • 353 miles of stream • Contains Lockington Dam (habitat and flow alterations are damaging watershed) • Mainly agriculture • Farmers working to improve riparian zones • Bonuses given to add filter strips, plant riparian zones and add fencing for cattle
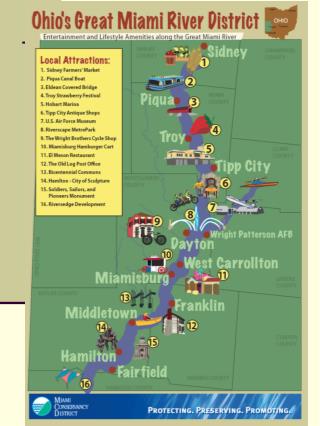
The yellow is row crops and the bright pink are cities like Dayton, Piqua, and Troy. Land Use
First 2 related, both due to channelization • Nutrients = fertilizer • Siltation results from channelization and construction
Hypothesis #1 As the QHEI increases, the IBI also increases. =
Analysis *QHEI and IBI are directly related. *In 1982, QHEI increased and IBI didn’t *Troy may be causing runoff and point-source pollution causing IBI to stay the same as QHEI increases.
Conclusion • Habitat quality (QHEI) such as riparian zone, substrate, and meanders greatly affect IBI. • Fish need clean water, High DO, and food to survive. • Great habitat will bring more fish diversity.
Hypothesis #2 • As the percent of agricultural land use (within 90 meters of the stream) increases, the IBI decreases. Where’s my friend Nemo? =
Agricultural Land Use vs. IBI • Inverse relationship • No significant discrepancies • Agriculture (within 90 meters of the stream) adds nutrients (fertilizer) which hurt fish (IBI) IBI Time-Place Analysis
Conclusion • Agriculture intrudes on the Riparian Zone • Nutrients (fertilizer) and soil run off into the stream • Causing an increase in siltation which destroys the fish habitat
Hypothesis number 3 • As the quality of the substrate increases the IBI also increases. =
IbI vs. Substrate IBI Minster Place and Time • Substrate is a component of the QHEI • IBI and Substrate quality are directly related • Siltation was a significant impairment –Causes low substrate quality
Conclusion • IBI depends on the substrate to be clean and free of siltation • If substrate is full of siltation (not clean) the IBI decreases • When substrate is full of silt fish don’t have a place to lay eggs or hide from predators
What Can We Do To Help? • Urban • Stop point source pollution • Slow down construction • Keep streets clean of oil and gas Agriculture Suburban • Plant riparian zones • Keep cattle out of streams • STOP channelization • Stop washing Detergents into sewers • Stop fertilizing lawns • Slow down construction Conserve!!!
Acknowledgements • Melanie-Our teacher that didn’t run away • Paula-Our great organizer • Our Parents-For letting us come • Kathryn-Our leader • Steve-Our Einstein / Vanna • Virginie-Our French computer expert • Shannon-Our wonderful web spinner • Leslie-The Boss • And all the rest of the staff at OSC • THANK YOU!!