Frequency Distribution presentation
I hope it is beneficiary for you

Frequency Distribution presentation
E N D
Presentation Transcript
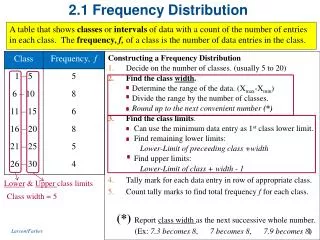
Frequency Distribution: • The data presented in frequency distribution table is known as “ grouped data” while the data in original form is known as “ungrouped data” . In terms of its instruction each class or group measurement has lower and upper limit , lower and upper boundaries, an interval and a middle value. • Example: Salary of 100 workers • Class limits: • A group in which we divide the data are called class interval. Each class interval consists of two class limits known as lower and upper class limits. Lower class limit is that limit at which interval is starts and upper class limit is that limit at which interval is end. • 40-50
Class Boundaries: • A class boundaries is mid way between upper limit of class and the lower limit of the next higher class. CB is obtained by adding the upper and lower class limit of the next class and divide by 2. • Mid Point: • Mid point of the class is that point which divides the class into two equal parts. It is obtained by dividing either the sum of the lower and upper limits of the class intervals by 2. • Building a Frequency Distribution Table: • The frequency distribution table can be constructed by the method given below. • 1. Find the range, that is difference between the largest and smallest observation. • 2. Divide the range by the number of class intervals to determine the size of class interval. In case of fraction appears, the next higher whole number is usually is taken as the size of the class interval.
3. determine the number of observations (frequency) falling into each class interval. This is best done by tally sheet. • 4. total the frequency column to see that all observed values have been marked. • Example • Building the frequency distribution table from the following soil compaction data. Use five class intervals. • 41,42,46,43,44,42,46,43,45,47,48,47,49,41,42,50,51 • Solution. • 1. Highest Observation = 51 • 2. Lower Observation = 41 • 3. Range 51 - 41 = 10 • 4. Size of class interval = Range/ total number of class intervals • = 10/5 • = 2 approximately
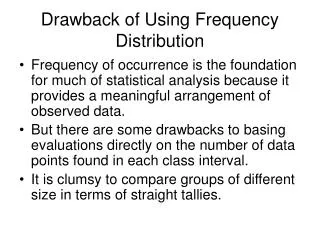
Relative Frequency: • A relative frequency distribution shows the proportion of the total number of observations associated with each value or class of values and is related to a probability distribution, which is extensively used in statistics.
Cumulative Frequency Distribution • Technically, a cumulative frequency distribution is the sum of the class and all classes below it in a frequency distribution. All that means is you’re adding up a value and all of the values that came before it. • Example :