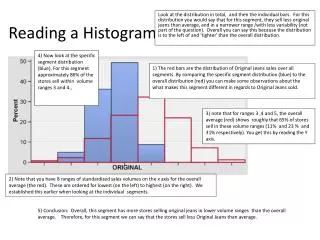
Making a frequency distribution and histogram
Making a frequency distribution and histogram. The Data. Make sure the data is quantitative Sort the data from smallest to largest Count how many. The Data. The data is sorted, quantitative, and there are 40 elements. Find the range and class width.


Making a frequency distribution and histogram
E N D
Presentation Transcript
The Data • Make sure the data is quantitative • Sort the data from smallest to largest • Count how many
The Data The data is sorted, quantitative, and there are 40 elements
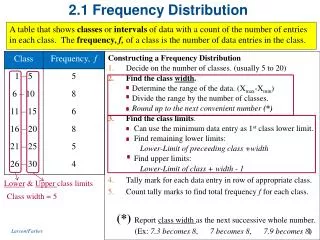
Find the range and class width • Range is found by subtracting the smallest from the largest • Class width is found by dividing the range by the number of class. • Always round the class width up to the same number of decimal places as the original data.
Range and class width • Range = 478-161 = 317 • For 6 class the class width would by • 317÷6 = 52.833 round up to 53
Make the distribution • Start with the smallest value as the lower class limit of the first class. • The class width will be added to a lower class limit to find the next lower class limit
Make the distribution • Look at the second classes lower limit and find the largest value that the data could be and not be in the second class. (usually one less than the second classes lower limit ) • The class width will be added to a upper class limit to find the next lower class limit (look at how these compare to the lower class limit of the next class)
Tallies and frequency • If the data is not in order you will want to do a tally to keep count for each class • Frequency is the number of time an element is in each class
Cumulative frequency, relative frequency, and class marks • Cumulative frequency is the running total. • It is found by adding a classes frequency to the Cumulative frequency of the class before • Relative frequency is a ratio of the classes frequency to the number of elements in the sample. • Class marks are the middle value of each class. • It is found by adding the upper and lower class limit together and then dividing by two.
Class Bounds • These are the points between each class • To find the class bound add the upper class limit of one class to the lower class limit of the next class and divide by 2 • You will also have to find the lower and upper bound • Look at the pattern and find the one below the first and also one above the last class
These are found by averaging the upper and lower class limits Found by adding or subtracting 53 (the class width) from the end and beginning