Download
1 / 34
380 likes | 613 Views
Overall Roadmap Technology Characteristics (ORTC) 2012. Alan Allan Winter Hsinchu Public Conference Rev 4, 12/05/12. 20 Years Of Technology Roadmap. 1991. First NTRS workshop 1992. 11 TWGs established. First edition of NTRS 1994, 1997. Second and third NTRS editions

E N D
Overall Roadmap Technology Characteristics(ORTC) 2012 Alan Allan Winter Hsinchu Public Conference Rev 4, 12/05/12 Hsinchu Public Conference, Rev 4, 12/05/12
20 Years Of Technology Roadmap • 1991. First NTRS workshop • 1992. 11 TWGs established. First edition of NTRS • 1994, 1997. Second and third NTRS editions • 1998. WSC approves internationalization of NTRS->ITRS with Europe, Japan, Korea and Taiwan participation • ITWGs established • 3 workshops/year (Europe, US, and Asia) • 2012 ITRS underway with 17 ITWGs Hsinchu Public Conference, Rev 4, 12/05/12
2012 ITRS Meetings Spring Meeting • April 23-25.Holland. Summer Meeting • July 8,9. Workshop in Monterey, CA • July 12. Presentations within SEMI West Winter Meeting • Dec 3-5 Taiwan • Dec 3,4. Workshop • Dec 5th. Public presentation Hsinchu Public Conference, Rev 4, 12/05/12
2012 ITRS ITWGs • System Drivers • Design • Test & Test Equipment • Process Integration, Devices, & Structures • RF and A/MS Technologies • Emerging Research Devices • Emerging Research Materials • Front End Processes • Lithography • Interconnect • Factory Integration • Assembly & Packaging • Environment, Safety, & Health • Yield Enhancement • Metrology • Modeling & Simulation • MEMs Hsinchu Public Conference, Rev 4, 12/05/12
2012 Update Figure X: Production Ramp-up Model and Technology/Cycle Timing Hsinchu Public Conference, Rev 4, 12/05/12
2012 Update Figure Y: A Typical Technology Production “Ramp” Curve for ERD/ERM Research and PIDS Transfer Timing * including an example for III/V Hi-Mobility Channel Technology Timing Scenario Hsinchu Public Conference, Rev 4, 12/05/12
2012 Update (from 2011 ITRS): Equiv Scaling & “Node Alignment” vs. ITRS Timing Trends Hsinchu Public Conference, Rev 4, 12/05/12
2011 ITRS Figure 4 Unchanged for 2012 – ORTC Table 1 Graphical Trends – Logic (MPU and high-performance ASIC) Half Pitch and Gate Length 16nm Long-Term ’19-’26 11 Source: 2011 ITRS - Executive Summary Fig 4 Hsinchu Public Conference, Rev 4, 12/05/12
2011 ITRS Figure 4 Unchanged for 2012 – ORTC Table 1 Graphical Trends – Logic (MPU and high-performance ASIC) Half Pitch and Gate Length 16nm Long-Term ’19-’26 12 Source: 2011 ITRS - Executive Summary Fig 4 Hsinchu Public Conference, Rev 4, 12/05/12
Updated MPU/DRAM Options We will narrow options for 22nmhp in 2013. Hsinchu Public Conference, Rev 4, 12/05/12
Updated Flash Options This table shows the requirements for 2-D flash development. The potential introduction of 3-D flash does not drive lithography. Hsinchu Public Conference, Rev 4, 12/05/12
2013 Proposal Figure Z [to replace WAS: 2012 ITRS Fig Z]: A Typical Wafer Generation Pilot Line and Production “Ramp” Curve applied to Forecast Timing Targets of the 450 mm Wafer Generation Hsinchu Public Conference, Rev 4, 12/05/12
2013 Proposal Figure Z [to replace WAS: 2012 ITRS Fig Z]: A Typical Wafer Generation Pilot Line and Production “Ramp” Curve applied to Forecast Timing Targets of the 450 mm Wafer Generation Hsinchu Public Conference, Rev 4, 12/05/12
2013 Proposal Figure Z [to replace WAS: 2012 ITRS Fig Z]: A Typical Wafer Generation Pilot Line and Production “Ramp” Curve applied to Forecast Timing Targets of the 450 mm Wafer Generation Hsinchu Public Conference, Rev 4, 12/05/12
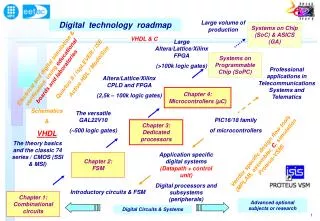
More than Moore: Diversification Analog/RF Passives HV Power Sensors Actuators [e.g. MEMS] Biochips Interacting with people and environment Non-digital content System-in-package (SiP) 130nm 90nm Baseline CMOS: CPU, Memory, Logic 65nm Information Processing Digital content System-on-chip (SoC) Combining SoC and SiP: Higher Value Systems More Moore: Miniaturization 45nm 32nm 22nm 16 nm . . . V Beyond CMOS Figure 4 The Concept of Moore’s Law and More Source: 2011 ITRS - Exec. Summary Fig. 4 Hsinchu Public Conference, Rev 4, 12/05/12
More than Moore: Diversification Analog/RF Passives HV Power Sensors Actuators [e.g. MEMS] Biochips Interacting with people and environment Non-digital content System-in-package (SiP) 130nm 90nm Baseline CMOS: CPU, Memory, Logic 65nm Information Processing Digital content System-on-chip (SoC) Combining SoC and SiP: Higher Value Systems More Moore: Miniaturization 45nm 32nm 22nm 16 nm . . . V Beyond CMOS Figure 4 The Concept of Moore’s Law and More Source: 2011 ITRS - Exec. Summary Fig. 4 Hsinchu Public Conference, Rev 4, 12/05/12
2012 Update ITRS ORTC Technology Trend Summary • Unchanged for 2012: MPU contacted M1 1) 2-year cycle trend through 2013 [27nm (“14nm” node)]; then 3-year trend to 2026 • 60f2 SRAM 6t cell Design Factor • 175f2 Logic Gate 4t Design Factor • Proposal Consideration for 2013 ITRS: Extension of 2-year M1 Trend 2) Unchanged for 2012 Tables:MPU Functions/Chip and Chip Size Models • Design TWG Model for Chip Size and Density Model trends – tied to technology cycle timing trends and cell design factors • ORTC line item OverHead (OH) area model, includes non-active area • Proposal Consideration for 2013 ITRS: Extension of 2-year M1 Trend • Unchanged for 2012 Tables:MPU GLpr, GLph – trends “smoothed” by 2011 PIDS modeling* 4) Unchanged for 2012 Tables: Max Chip Frequency trends (reset in 2011 to 3.6Ghz/2010 plus 4% CAGR trend) • Unchanged for 2012 Tables:VddHigh Performance, Low operating and standby line items from 2011 PIDS model track “smoothed” gate length changes* *Note: See PIDS tables for 2012 Update to be released at end of 2012 for impact due to acceleration of MugFET and FDSOI “Equivalent Scaling” timing into 2012 Hsinchu Public Conference, Rev 4, 12/05/12
2012 Update ITRS ORTC Technology Trend Summary (cont.) • Unchanged for 2012 Tables: DRAM contacted M1: • One-year M1 acceleration • New for 2012: 4f2 one-year delay to 2014 (affects Chip Size Model*) 7) Unchanged for 2012 Tables: Flash Un-contacted Poly: • 2+-year pull-in of Poly; however slower 4-year cycle (0.5x per 8yrs) trend to 2020/10nm; then 3-year trend to 2022/8nm; then Flat Poly after 2022/8nm • and 3bits/cell extended to 2018; 4bits/cell delay to 2022 • Unchanged for 2012 Tables: DRAM Bits/Chip; Chip Size Model adjusted*: • 3-year generation “Moore’s Law” bits/chip doubling cycle target (1-2yr delay for smaller chip sizes <30mm2 – 2x/2.5yrs) • *Chip Size Model adjusted for 4f2 one-year delay to 2014 • Unchanged for 2012 Tables: Flash Bits/Chip and Chip Size Model: • 3-year generation “Moore’s Law” bits/chip doubling cycle target (after 1-yr acceleration; then flat @ 1-2Tbits; keep chip size <160mm2) • 3D on-chip bit layers with relaxed half-pitch tradeoffs are included for maximum bits per chip • New 2012 Update Survey Emphasis: 2016-2025 layer range from 8/32nm -128/18nm Layers to 16/48nm – 256/24nm Layers (option C in 2011 ORTC Table 2) Hsinchu Public Conference, Rev 4, 12/05/12
2012 Update ITRS ORTC Technology Trend Summary (cont.) 10) Unchanged for 2012 Tables: ORTC Table 5 - Litho # of Mask Counts MPU, DRAM, • Litho Survey inputs Unchanged for 2012 • IC Knowledge (ICK) model contribution extends mask levels range to 2024 • 2013 Update: update ICK model to 2011 Mask Counts 11) Updated for 2012 Update [and 2013 ITRS Preparation]: IRC 450mm Timing Graphic Position: • Timing Status Updated for 2012 and 2013 ITRS guidance • Consortia work continues • IDM and Foundry Pilot lines: 2013-14; • “Risk Start” Production: 2015-16 [corrected early target in 2012 Update; move to 2016 in 2013 ITRS Targets] • G450C Consortium continues good progress on 450mm program activities to meet the ITRS Timing 1) Consortium operations are using 450mm early test wafer process, metrology and patterning capability to support Supplier development • 193 immersion multiple exposure litho tools are under development to support consortium and manufacturers’ schedules for target “1xnm technology” goal • 450mm increasing silicon demand is needed from consortium demonstrations to support development 3) Europe Position Unchanged – EEMI450 status was reviewed with IRC in Netherlands Apr’12 4) 300mm wafer generation in parallel line item header with 450mm; • Including Technology upgrade assumptions • Assuming compatibility of 300mm productivity extensions into the 450mm generation; • ITRS-based ICK Strategic Model commercially available and updated to 2011 ITRS, including 300mm and 450mm 2009-2026 Range Scenarios for silicon and equipment demand 12) Unchanged for 2012 Update: More than Moore white paper online at www.itrs.net • MtM Workshop completed in Netherlands, in April and reviewed at Summer ITRS meeting • Europe workshop included new iNEMI applications presentation (by Europe iNEMI Mgr. – highlights on Automotive; Medical; Energy; Lighting; et al) • ITRS MEMS TWG and Chapter cross-roadmap work underway for 2013 iNEMI Roadmap Hsinchu Public Conference, Rev 4, 12/05/12
2013 Renewal Preparation ITRS ORTC Technology Trend Summary (cont.) Technology Pacing Cross-TWG Study Group (CTSG) 2012 work preparation for 2013 ITRS Renewal (kickoff Dec’12), including: • IRC Equivalent Scaling Graphic Update • Updated timing placement of MuGFET, FDSOI,and III/V Ge Timing; now based on one IDM or Foundry company, who may lead technology production ramp • Design and FEP Logic Technology Trends • Monitor and Update MPU and Leading Edge Logic technology trends, including • Ongoing- evaluate alignment of “nodes” with latest M1 industry status • Consider High Performance vs. Low Power transistor type needs • Consider extending 2yr cycle to at least 2017/14nm (”7nm” node) • Functions/Chip and Chip Size Models tbd; based on final consensus of new proposals • On-Chip Frequency Proposals – Align with PIDS modeling and evaluate/update to industry trends • PIDS and FEP Memory Survey Proposal Updates • Presently unchanged for 2013 – ongoing monitor of DRAM and Flash technology trends • Litho and FEP (and PIDS and Design) Survey for CD Variability and Control • Monitor and Update Litho and Etch Gpr/Gph Ratio for CD control trends • A&P/Design Power (Thermal) Model • Develop proposals for Power Dissipation "hot spot" model rather than chip area basis • PIDS/Design Max On-chip Frequency vs Intrinsic Modeling • Targeted for 8% (vs. 13%) CAGR (1/CV/I) intrinsic transistor performance (to align with 2011 ITRS 4% Design Frequency trend) • Consider Intrinsic Transistor and Ring Oscillator model Changes • Including MASTAR static modeling near-term and Purdue dynamic long-term modeling • Including “equivalent scaling” tradeoffs (FDSOI, MuGFET, III-V/Ge) with dimensional scaling • YE Defect Density Modeling • Update ORTC Defect Density model work to latest Litho Mask Count Model – still seeking defect modeling resources support 24 Hsinchu Public Conference, Rev 4, 12/05/12
Summary 25 • The Technology Roadmap turns 20! • ITRS is a live and evolving process, mapping semiconductor industry needs and challenges ahead of implementation • The initial NTRS 11 chapters have became 17 • The ITRS is used as a reference document by the whole semiconductor industry • Public presentations: July 12, 2012 during SEMICON West; and December 5, 2012 in Hsinchu Taiwan • Publicly accessible on line at www.itrs.net Hsinchu Public Conference, Rev 4, 12/05/12
Public Conference Backup Industry Historical Gate Density and SRAM Cell Size Trends 2012 ITRS Gate Density and SRAM Cell Size analysis Work in Progress Transistor Dimensional Definitions… Hsinchu Public Conference, Rev 2, 11/28/12
< 2013 60f2 area @2yr M1 cycle 0.5x/2yrs = -29% CAGR 2011 ORTC Figure 6 Product Function Size Trends Hsinchu Public Conference, Rev 4, 12/05/12 [transistor + capacitor] ITRS MPU/ASIC Alignment Design TWG Actual SRAM [60f2] & Logic Gate [175f2] [4 plus Resistor Load] “22 nm”/39.8nm h-p, 0.092 um2 [= 58.0 x 0.03978^2] [IDF 2009] MPU/ASIC ITRS 2011 Target 6-transistor “22nm” Node SRAM [60f2] = 0.0859um2 cell area @ 37.84nm M1 half-pitch 0.18u x 0.48u = 0.0864um2 MPU/ASIC Historical 1997 Target 6-transistor SRAM [60f2] = 10um2 cell area @ 428nm M1 half-pitch Intel 6T Pentium Pro L2 cache = 33um2 “…0.35u minimum gate…” UMC 2Mbit/11.25; Samsung 4Mbit/11.7; Winbond 4T1Mbit SRAM = 10.15um2 “…using the samie technology generation (“0.3um process”)…” “…analyzed by ICE’s laboratory in 1996…” [Source: IC Insights 1997 Fig. 8-12: http://smithsonianchips.si.edu/ice/ cd/MEMORY97/SEC08.PDF ] MPU/ASIC ITRS 2011 Target 6-transistor “32nm” Node SRAM [60f2] = 0.172um2 cell area @ 53.51nm M1 half-pitch 0.25u x 0.68u = 0.172um2 2011 ITRS: 2011-2026 “32 nm”/56.25nm h-p, 0.171 um2 [= 54.0 x 0.05625^2] [IDF 2009] Source: 2011 ITRS - Executive Summary Fig 6 Long-Term ’19-’26 Hsinchu Public Conference, Rev 4, 12/05/12 0.35um minimum gate “0.3um”
Gate Density 2011 and 2012 ITRS: Unchanged 2-year cycle through 2013 Near Term 2013-2020 Long Term 2021-2028 ITRS Flash Poly H-pitch 45 38 20 14 10 8 8 8 8 ITRS DRAM M1 H-pitch 45 32 22 16 11 8 5.5 4 “Logic Node”: 4532221410753.52.51.8 ITRS M1 H-pitch [2013 Proposal]: 76 54 38 27 19 13 10 6.7 4.7 3.3 > 2017 2x/3yrs = 26% CAGR < 2013 2x/2yrs = 41% CAGR 28 Hsinchu Public Conference, Rev 4, 12/05/12
Gate Density Historical Perspective IC Insights Historical Data: 1995-2010 on ~2-year cycle ITRS : < 2013 10x/7yrs ~ 2x/2yrs = 41% CAGR 29 Hsinchu Public Conference, Rev 4, 12/05/12
SRAM Cell Size 2011 and 2012 ITRS: Unchanged 2-year cycle through 2013 ITRS Flash Poly H-pitch 45 38 20 14 10 8 8 8 8 ITRS DRAM M1 H-pitch 45 32 22 16 11 8 5.5 4 “Logic Node”: 4532221410753.52.51.8 ITRS M1 H-pitch [2013 Proposal]: 76 54 38 27 19 13 10 6.7 4.7 3.3 Near Term 2013-2020 Long Term 2021-2028 > 2017 0.5x/3yrs = -21% CAGR < 2013 0.5x/2yrs = -29% CAGR 30 Hsinchu Public Conference, Rev 4, 12/05/12
< 2013 60f2 area @2yr M1 cycle 0.5x/2yrs = -29% CAGR SRAM Historical Perspective (Data: on ~2-year cycle) [Source: VLSIR weSRCH Website] SRAM Cell Size Scaling 65 nm, 0.570 um2(193 nm dry) 45 nm, 0.346 um2(193 nm dry) 32 nm, 0.171 um2(193 nm immersion) Transistor density continues to double every 2 years Hsinchu Public Conference, Rev 4, 12/05/12
1000 Pitch Pitch Pitch Gate Pitch (nm) 65nm 0.7x every 2 years 45nm 32nm 112.5 nm 100 1995 2000 2005 2010 Transistor and M1 Pitch Perspective vs. Drive Current/Performance (Data: on ~2-year cycle) [Source: VLSIR weSRCH Website] Transistor Density and Performance 2.0 1.0 V, 100 nA I OFF 32nm 45nm 1.5 (mA/um) 65nm 90nm 1.0 130nm Drive Current NMOS 0.5 PMOS 0.0 1000 100 Gate Pitch (nm) Drive currents continue to increase while gate pitch scales Hsinchu Public Conference, Rev 4, 12/05/12
2012 ITRS Definition Work – Clarification of the M1 Half Pitch To clarify the ORTC Table 1 relationship to Gate Length* And for consistency with Interconnect TWG Transistor M1 contacted half-pitch [and public - sometimes presented (IEDM, etc) as “Transistor Pitch” or “Gate Pitch”] ; *vs. Printed Gate Length (GLpr) (sometimes compared to “CD” or Critical Dimension for manufacturing process control); and finally the publically-measurable Physical Gate Length, (GLph – see also the PIDS chapter) [Note: The ITRS does not utilize any single-product “node” designation reference; Flash Poly and DRAM M1 half-pitch are still litho drivers; however, other product technology trends may be drivers on individual TWG tables] GLph Hsinchu Public Conference, Rev 4, 12/05/12
2011 Interconnect TWG -Hierarchical Cross Sections Hsinchu Public Conference, Rev 4, 12/05/12