Download
1 / 31
310 likes | 410 Views
Explore cross-scale assessment of biodiversity, embracing the GLOBIO3 model and NCI framework. Discuss impacts, pressures, and responses across the globe in this insightful conference.

E N D
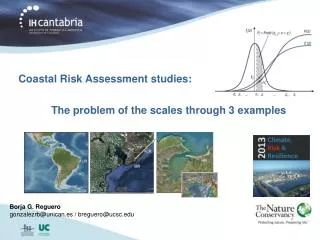
International conference Millennium Assessment: Bridging scales and epistemologies Cross-scale Assessment of Biodiversity;Opportunities and Limitations of the GLOBIO3 modeland the Natural Capital Index (NCI) framework
New Challenges • Millennium development Goals • Johannesburg 2010 target • CBD biodiversity indicators • Applications in the MA • National (BINU) and regional EU / OECD applications
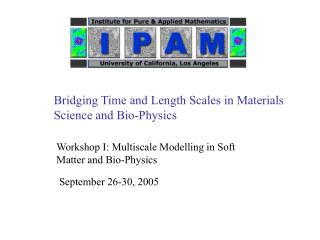
Outline presentation Previous work GEO3 and PEEP land use change agricultural intensity climate change GLOBIO 3 applied to Latin America Biodiversity Assessment Ecuador Upscaling national to global Downscaling global to national 2010 target Global interactive research
Key questions to be addressed by GLOBIO 3 • What is changing: • biodiversity (ecosystems, species and their abundance) • natural areas • expected trends (scenario’s) • geographically explicit • most vulnerable areas • Why is it changing • different pressures • relative importance of pressures • What can we do about it • effects of response options (e.g. to reach policy targets)
Comparison pressure indices:Global (GEO3) and Regional EU (Peep)
Suggestions for improvements Methodology for construction of pressure indices Considering agricultural landscapes (agroecosystems) dose-respons relationships from species abundance literature Upscaling local information Downscaling global information
Overall Biodiversity B = LU * Agr* For * C * N * F B = Biodiversity of a region LC = biodiversity value for land cover type Agr = biodiversity reduction due to agriculture For = biodiversity reduction due to forestry C = biodiversity loss due to climate change N = biodiversity loss due to Nitrogen pollution F = biodviversity loss due to Fragmentation
Expected ecosytem quality in agroecosystems based on average production intensity (per Farming System) Average based on land use change only 30%
Biodiversity loss per farming systemGLOBIO3 pressure approach (2000) Remaining biodiversity? Forest based farming system 94% Coastal plantation & mixed 73% Intensive Highland Mixed North Andes 53%
Siglas Arbor A. erosión Arroz Banano Cacao Camar Frutales Maíz Natural Pastos forestales bha 0,10 1,00 0,40 bhai 1,00 0,40 bhc 0,25 0,10 0,25 0,10 0,40 0,10 0,10 1,00 0,40 bhmoc 0,25 0,10 0,10 1,00 0,40 bhmor 0,10 0,25 0,10 1,00 0,40 bsmor 1,00 bsoc 0,25 0,10 0,25 0,10 0,40 0,10 0,25 0,10 1,00 0,40 h 0,10 0,10 0,25 0,10 0,30 0,10 0,25 1,00 m 0,10 0,10 0,10 1,00 n 0,10 1,00 ph 0,10 0,25 0,25 1,00 0,20 ps 0,10 1,00 vhi 0,10 0,25 0,25 1,00 0,20 vsi 0,25 0,10 0,25 0,25 1,00 0,20 Biovalores (ecosistema x producción)
Ecosystem quality for agroecosystems per ecosystem in Ecuador
Área intervenida, mosaico y natural 50-70% ecosystem quality
Biodiversity impact from Climate Change Shifts of Biomes (IMAGE) and species (Euromove)
Downscaling from the global modelBiodiversity Situation 2000 NCI Loss by land use change 27% Loss by international air pollution 0% Loss by climate change 2% Loss by agricultural intensification 5% Loss by forest explotation 1% _______________________________________ Natural Capital (2000) 65%
indicators models monitoring Interaction of stakeholders with reference to the evaluation of the 2010 target
Which process to indicate? • The uniformity process of biodiversity loss: • many rare species becoming more rare and • few common species becoming more common • (change of abundance or distribution of species) Main factors: - habitat loss - loss ecosystem quality
The Natural Capital Index: Biodiversity =area size x ecosystem quality Ecosystem quality = average abundance/distribution of a set of characteristic species in relation to an ideal, original or historical reference
Comparison biodiversity state (NCI) of two ecosystems in Ecuador 87,23 7,35 77,05 2,83 bha = 87,23 5,1 28,20 7,14 15,96