Download
1 / 47
490 likes | 651 Views
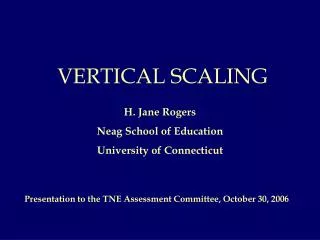
Vertical Scaling and the Development of Skills. Marty McCall Northwest Evaluation Association WERA/OSPI State Assessment Conference SeaTac, WA December 7, 2007. Examining constructs through vertical scales. What are scales, anyway? Examples: temperature length volume time

E N D
Vertical Scaling and the Development of Skills Marty McCall Northwest Evaluation Association WERA/OSPI State Assessment Conference SeaTac, WA December 7, 2007
Examining constructs through vertical scales • What are scales, anyway? Examples: temperature length volume time What do they have in common?
Achievement scales – Latent constructs • A framework for measuring student achievement. Scores refer to a point on the scale. What is the meaning of the point on the scale? Example: A score of 400 on the 4th grade Reading WASL. What does it mean? How do you know? What do you know about a score of 385 on the same test? How do you know?
Achievement scales A framework for measuring the difficulty of test questions. Each item has a difficulty rating expressed as a point on the scale. What is the meaning of the point on the scale? A student with a score of 400 gets items with a difficulty of 400 right about half the time.
Achievement scales WASL scales were originally developed separately for each grade and subject. Items were written specifically for each set of grade level standards. The scale was developed using these items and students in the tested grade. For each grade the score representing meeting standard was set at 400.
What are vertical scales? • span ages or grades • Provide a common framework for measurement over time • Scores show change over time • Items taken at different times are on the same scale How do you interpret the difference between a 400 on the 4th grade WASL and a 400 on the 7th grade WASL?
Vertical scales articulate content across grades • In development of vertical scales, the progression from early skills to late skills is used throughout the process. • What are the foundational skills? • How do they relate to later, more complex skills? • Gives an empirical check to theory
Who uses vertical scales? • CTB McGraw • TerraNova Series • Comprehensive Test of Basic Skills (CTBS) • Harcourt • Stanford Achievement Test • Metropolitan Achievement Test • Statewide NCLB tests • All states using CTB or Harcourt’s tests • Mississippi, North Carolina, Oregon, Idaho • Woodcock cognitive batteries • NWEA – MAP tests
Why use vertical scales? • To model growth: Tests that are vertically scaled are intended to support valid inferences regarding growth over time. --Patz, Yao, Chia, Lewis, & Hoskins (CTB/McGraw) • To study cognitive changes: “When people acquire new skills, they are changing in fundamental interesting ways. By being able to measure change over time it is possible to map phenomena at the heart of the educational enterprise.” --John Willet
Modeling Growth The original NCLB model was a status model. After intensive discussion, a growth component pilot has been added. Why are growth models better than status models in evaluating school effectiveness? Why did NCLB initially reject them?
Modeling Growth Growth models share common characteristics: -Measure change over time -Take initial conditions into account -Compare to some expectation of growth
Take initial conditions into account Students with low scores grow more than those with high scores. (WASL research shows this as well.) What happens if you don’t account for this? What is expected growth? Normative, policy, both.
Modeling Cognitive Changes What skills are acquired first? What skills are precursors of others? What skills are components or features of others? As people change over time, what patterns are present in the data?
What makes a vertical achievement scale different from other scales? Why is there a concern in educational settings? • Qualitative changes • Experienced differently • Described differently • Perceived discontinuities • Requires different measurement instruments in different areas of the scale
What makes a vertical scale different from other scales? Compare with physical scales, e.g. temperature-- • Qualitative changes • Experienced differently • Described differently • Perceived discontinuities • Requires different measurement instruments in different areas of the scale
What is different about achievement scales? • Physical scales • Measured directly • No controversy over dimensional structure • Achievement scales • Latent, inferred • Differences of opinions about dimensional structure • Choice of metric determined by substantive belief First ask the question: Is there a construct that grows over time? Then look at structure.
Beliefs more conducive to vertical scaling The construct embodies a complex ability—one that has many parts and relations between the parts The mature ability (reading or doing algebra problems) involves many component skills working together The ability itself is unlike any of its component skills. Complex skills are emergent properties of simpler skills and in turn become components of still more complex skills
Why NOT use vertical scales?Criticism centers on two major issues • Linking error • Violations of dimensionality assumptions
Why NOT use vertical scales? • Trying to merge two or more existing scales can be tricky (e.g., merging existing benchmark scales). • Merging scales from tests given far apart in time can be difficult to interpret (e.g. Haertel’s analysis of NAEP scales) • Fixed form linking may be too weak for vertical scaling (e.g., Huynh, Meyer & Barton)
Issue #1: Linking creates error What is linking? Finding common information to associate students and items to the same scale Common item linking. Common person linking. Finding the unknown from the known
Issue #1: Linking creates error There is some error associated with all measurement, but current methods of vertical scaling greatly minimize it. These methods include: --triangulation with multiple forms or common person links --comprehensive and well-distributed linking blocks --continuous adjacent linking --fixed parameter linking in adaptive context
How do people actually create and maintain vertical scales? • Harcourt – common person for SAT and comprehensive linking blocks • CTB – methods include concurrent calibration, non-equivalent anchor tests (NEAT), innovative linking methods • ETS – (the king of NEAT) – also uses an integrated IRT method (Davier & Davier)
How do we do it? Scale establishment method extensively described in Probability in the Measurement of Achievement By George Ingebo
A 1 B 2 3 4 1 3 2 4 3 2 C D 3 4 How do we do it?Extensive initial linking
Fixed Form Vertical Linking for non-adjacent grades Benchmark X Form Vertical Linking Block Benchmark X +1 Form
Adaptive Continuous Vertical Linking Benchmark X Benchmark X +1
Issue #2Dimensionality Reading and mathematics at grade 3 looks very different than those subjects at grade 8. In addition, the curricular topics differ at each grade. How can they be on the same scale?
The Assumption of Unidimensionality A student’s response to an item is determined by his or her ability in the subject (construct) being tested. When this single ability is taken into account, there is no correlation among items. The underlying construct does not have statistical dimensions or factors. Is this a convenient fiction? 28
Study of Dimensionality: McCall & Hauser - Item response theory and longitudinal Modeling: The real world is less complicated than we fear. Presented at the MSDE/MARCES Conference-In press Do content areas within grades form statistical dimensions? Does essential unidimensionality hold throughout the scale? Looking for method to evaluate dimensionality in CATs
Study of Dimensionality: Used reading and mathematics items following state content design in grades 3 through 8-- 252 items in each subject Items had been used in fixed form tests within grades and had also been administered adaptively across grades. Were able to look compare dimensionality of an item set used on both fixed form and adaptive tests.
Do content areas within grades form statistical dimensions? Used method from Bejar (1980). “A procedure for investigating the unidimensionality of achievement tests based on item parameter estimates” J of Ed Meas, 17(4), 283-296 Calibrate each item twice; once, using responses to all items on the test (the usual method); again using only responses to items in the same goal area.
Does essential unidimensionality hold throughout the scale? Dimensionality detection methods usually involve looking at common-form tests. Is there a good way to examine dimensionality in CATs? • Use Yen’s Q3 statistic to do an exploratory dimensionality study
Pairs of responses from adaptive tests – NWEA’s Measures of Academic Progress Over 49 million response pairs per subject Limited study to pairs that had occurred on at least 120 tests.
Basic concept: When the assumption of unidimensionality is satisfied, responses exhibit local independence. That is, when the effects of theta are taken into account, correlation between responses is zero. Q3 is the correlation between residuals of response pairs.
dik is the residual: where: uik is the score of the kth examinee on the ith item Pi(qk) is as given in the Rasch model:
The correlation taken over examinees who have taken item i and item j is: Fishers r to z’ transformation gives a normal distribution to the correlations: Q3 values tend to be negative (Kingston & Doran)
Pairs of responses from adaptive tests – NWEA’s Measures of Academic Progress These are very small Q3 values compared to what we had seen in the literature. This indicates that the constructs are unidimensional within and across grades
Good news, right? • We concluded that our scale was essentially unidimensional within each grade and that the vertical scale was unidimensional throughout. • But then we started thinking…..
Is Q3 adequate for evaluating CAT dimensionality? • Adaptive tests seek the most informative items for the examinee, quickly homing in on items whose expected p-value is around .5. • There is a possibility that variance of residuals is restricted leading to low correlations. NEW Study – establish plausible Q3 values to aid interpretation
Criteria adopted • Using the standard deviation of the Q3 statistic for the unidimensional condition (.011), the criteria for large Q3 statistics were set as more than .022 from the mean for each condition. • Criteria for large Q3 statistics for simulated data are: -.047 < Q3 < -.0036 Most of the Condition 4 pairs with large positive Q3 statistics are items from the same half of the test. Pairs with large negative correlations are from different halves. Q3 can detect violations of local independence.
Criteria adopted for adaptive data Neither reading nor math showed patterns of local dependence corresponding to grade level. Reading did not show local dependence corresponding to content structure. Mathematics did show evidence of local dependence related to content structure.
What we have found regarding dimensionality: • New topics build on earlier ones and show up statistically as part of the construct • Although they may not be specified in later standards, early topics and skills are embedded in later ones (e.g., phonemics, number sense) • Essential unidimensionality holds throughout the scale with minor dimensions of interest
Thank you for your attention. Marty McCall Northwest Evaluation Association5885 SW Meadows Road, Suite 200Lake Oswego, Oregon 97035-3256Phone: 503-624-1951FAX: 503-639-7873Marty.McCall@nwea.org