Millennium Ecosystem Assessment Findings
400 likes | 559 Views
Millennium Ecosystem Assessment Findings. Largest assessment of the health of Earth’s ecosystems. Experts and Review Process Prepared by 1360 experts from 95 countries 80-person independent board of review editors Review comments from 850 experts and governments

Millennium Ecosystem Assessment Findings
E N D
Presentation Transcript
Largest assessment of the health of Earth’s ecosystems • Experts and Review Process • Prepared by 1360 experts from 95 countries • 80-person independent board of review editors • Review comments from 850 experts and governments • Includes information from 33 sub-global assessments • Governance • Called for by UN Secretary General in 2000 • Authorized by governments through 4 conventions • Partnership of UN agencies, conventions, business, non-governmental organizations with a multi-stakeholder board of directors
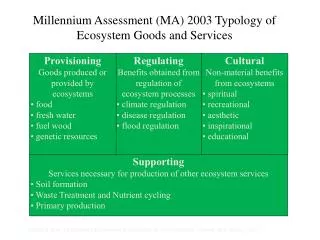
Focus: Ecosystem Services The benefits people obtain from ecosystems
Focus: Consequences of Ecosystem Change for Human Well-being
Human Well-being Indirect Drivers Ecosystem Services Direct Drivers MA Framework • Indirect Drivers of Change • Demographic • Economic (globalization, trade, market and policy framework) • Sociopolitical (governance and institutional framework) • Science and Technology • Cultural and Religious • Human Well-being and • Poverty Reduction • Basic material for a good life • Health • Good Social Relations • Security • Freedom of choice and action • Direct Drivers of Change • Changes in land use • Species introduction or removal • Technology adaptation and use • External inputs (e.g., irrigation) • Resource consumption • Climate change • Natural physical and biological drivers (e.g., volcanoes)
MA Findings - Outline • 1. Ecosystem Changes in Last 50 Years • 2. Gains and Losses from Ecosystem Change Three major problems may decrease long-term benefits • Degradation of Ecosystem Services • Increased Likelihood of Nonlinear Changes • Exacerbation of Poverty for Some People • 3. Ecosystem Prospects for Next 50 Years • 4. Reversing Ecosystem Degradation
Finding #1 • Over the past 50 years, humans have changed ecosystems more rapidly and extensively than in any comparable period of time in human history • This has resulted in a substantial and largely irreversible loss in the diversity of life on Earth
Unprecedented change: Ecosystems • More land was converted to cropland in the 30 years after 1950 than in the 150 years between 1700 and 1850 • 20% of the world’s coral reefs were lost and 20% degraded in the last several decades • 35% of mangrove area has been lost in the last several decades • Amount of water in reservoirs quadrupled since 1960 • Withdrawals from rivers and lakes doubled since 1960
Unprecedented change: Biogeochemical Cycles • Since 1960: • Flows of biologically available nitrogen in terrestrial ecosystems doubled • Flows of phosphorus tripled • > 50% of all the synthetic nitrogen fertilizer ever used has been used since 1985 • 60% of the increase in the atmospheric concentration of CO2 since 1750 has taken place since 1959 Human-produced Reactive Nitrogen Humans produce as much biologically available N as all natural pathways and this may grow a further 65% by 2050
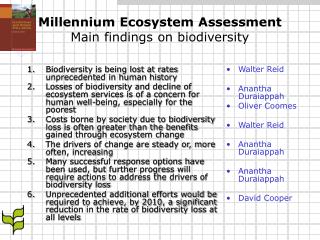
Significant and largely irreversible changes to species diversity • The distribution of species on Earth is becoming more homogenous • Humans have increased the species extinction rate by as much as 1,000 times over background rates typical over the planet’s history (medium certainty) • 10–30% of mammal, bird, and amphibian species are currently threatened with extinction (medium to high certainty)
MA Findings - Outline • 1. Ecosystem Changes in Last 50 Years • 2. Gains and Losses from Ecosystem Change Three major problems may decrease long-term benefits • Degradation of Ecosystem Services • Increased Likelihood of Nonlinear Changes • Exacerbation of Poverty for Some People • 3. Ecosystem Prospects for Next 50 Years • 4. Reversing Ecosystem Degradation
Finding #2 • The changes that have been made to ecosystems have contributed to substantial net gains in human well-being and economic development • Since 1960, while population doubled and economic activity increased 6-fold, food production increased 2 ½ times, food price has declined, water use doubled, wood harvest for pulp tripled, hydropower doubled. • But these gains have been achieved at growing costs that, unless addressed, will substantially diminish the benefits that future generations obtain from ecosystems
Degradation and unsustainable use of ecosystem services • Approximately 60% (15 out of 24) of the ecosystem services evaluated in this assessment are being degraded or used unsustainably • The degradation of ecosystem services often causes significant harm to human well-being and represents a loss of a natural asset or wealth of a country
Degradation of ecosystem services often causes significant harm to human well-being • The total economic value associated with managing ecosystems more sustainably is often higher than the value associated with conversion • Conversion may still occur because private economic benefits are often greater for the converted system
The degradation of ecosystem services represents loss of a capital asset • Loss of wealth due to ecosystem degradation is not reflected in economic accounts • Ecosystem services, as well as resources such as mineral deposits, soil nutrients, and fossil fuels are capital assets • Traditional national accounts do not include measures of resource depletion or of the degradation of these resources • A country could cut its forests and deplete its fisheries, and this would show only as a positive gain in GDP without registering the corresponding decline in assets (wealth) • A number of countries that appeared to have positive growth in net savings (wealth) in 2001 actually experienced a loss in wealth when degradation of natural resources were factored into the accounts
Increased likelihood of nonlinear changes • There is established but incomplete evidence that changes being made in ecosystems are increasing the likelihood of nonlinear changes in ecosystems (including accelerating, abrupt, and potentially irreversible changes), with important consequences for human well-being
Examples of nonlinear change • Fisheries collapse • Eutrophication and hypoxia • Disease emergence • Species introductions and losses • Regional climate change
Level of poverty remains high and inequities are growing • Economics and Human Development • 1.1 billion people surviving on less than $1 per day of income. 70% in rural areas where they are highly dependent on ecosystem services • Inequality has increased over the past decade. During the 1990s, 21 countries experienced declines in their rankings in the Human Development Index • Access to Ecosystem Services • An estimated 852 million people were undernourished in 2000–02, up 37 million from the period 1997–99 • Per capita food production has declined in sub-Saharan Africa • Some 1.1 billion people still lack access to improved water supply, and more than 2.6 billion lack access to improved sanitation • Water scarcity affects roughly 1–2 billion people worldwide
Ecosystem services and poverty reduction • Degradation of ecosystem services harms poor people • Half the urban population in Africa, Asia, Latin America, and the Caribbean suffers from one or more diseases associated with inadequate water and sanitation • The declining state of capture fisheries is reducing an inexpensive source of protein in developing countries. Per capita fish consumption in developing countries, excluding China, declined between 1985 and 1997 • Desertification affects the livelihoods of millions of people, including a large portion of the poor in drylands • Pattern of winners and losers has not been taken into account in management decisions
Ecosystem services and poverty reduction • Critical concern: Dryland systems • Cover 41% of Earth’s land surface and more than 2 billion people inhabit them • Lowest levels of human well-being • Only 8% of the renewable water supply • Per capita water availability is two thirds of the level required for minimum levels of human well-being • Approximately 10–20% of drylands are degraded • Experienced the highest population growth rate in the 1990s
MA Findings - Outline • 1. Ecosystem Changes in Last 50 Years • 2. Gains and Losses from Ecosystem Change Three major problems may decrease long-term benefits • Degradation of Ecosystem Services • Increased Likelihood of Nonlinear Changes • Exacerbation of Poverty for Some People • 3. Ecosystem Prospects for Next 50 Years • 4. Reversing Ecosystem Degradation
Finding #3: • The degradation of ecosystem services could grow significantly worse during the first half of this century and is a barrier to achieving the Millennium Development Goals
Direct drivers growing in intensity • Most direct drivers of degradation in ecosystem services remain constant or are growing in intensity in most ecosystems
MA Scenarios • Not predictions – scenarios are plausible futures • Both quantitative models and qualitative analysis used in scenario development
Changes in direct drivers Changes in crop land and forest area under MA Scenarios Crop Land Forest Area
Changes in direct drivers • Habitat transformation: • Further 10–20% of grassland and forestland is projected to be converted by 2050 • Overexploitation, overfishing: • Pressures continue to grow in all scenarios Invasive alien species: • Spread continues to increase
Changes in direct drivers:Nutrient loading • Humans have already doubled the flow of reactive nitrogen on the continents, and some projections suggest that this may increase by roughly a further two thirds by 2050 Estimated Total Reactive Nitrogen Deposition from the Atmosphere Accounts for 12% of the reactive nitrogen entering ecosystems, although it is higher in some regions (e.g., 33% in the United States)
Changes in direct drivers:Climate Change • Potential future impacts • By the end of the century, climate change and its impacts may be the dominant direct driver of biodiversity loss and changes in ecosystem services globally • Net harmful impact on ecosystem services • The balance of scientific evidence suggests that there will be a significant net harmful impact on ecosystem services worldwide if global mean surface temperature increases more than 2o C above preindustrial levels (medium certainty). This would require CO2 stabilization at less than 450 ppm.
Degradation of ecosystem services is a significant barrier to achievement of MDGs • Many of the regions facing the greatest challenges in achieving the 2015 targets coincide with regions facing the greatest problems of ecosystem degradation • Although socioeconomic factors will play a primary role in achieving many of the MDGs, targets are unlikely to be met without improvement in ecosystem management for goals such as: • Poverty Reduction • Hunger • All four MA scenarios project progress but at rates far slower than needed to attain the MDG target. The improvements are slowest in the regions in which the problems are greatest: South Asia and sub-Saharan Africa • Child mortality • Three of the MA scenarios project reductions in child undernourishment of between 10% and 60% but undernourishment increases by 10% in one. • Disease • Progress toward this Goal is achieved in three scenarios, but in one scenario the health and social conditions for the North and South further diverge, exacerbating health problems in many low-income regions • Environmental Sustainability including access to water
MA Findings - Outline • 1. Ecosystem Changes in Last 50 Years • 2. Gains and Losses from Ecosystem Change Three major problems may decrease long-term benefits • Degradation of Ecosystem Services • Increased Likelihood of Nonlinear Changes • Exacerbation of Poverty for Some People • 3. Ecosystem Prospects for Next 50 Years • 4. Reversing Ecosystem Degradation
Finding #4: • The challenge of reversing the degradation of ecosystems while meeting increasing demands for their services can be partially met under some scenarios that the MA considered but these involve significant changes in policies, institutions and practices, that are not currently under way • Many options exist to conserve or enhance specific ecosystem services in ways that reduce negative trade-offs or that provide positive synergies with other ecosystem services
Improvements in services can be achieved by 2050 • Three of the four scenarios show that significant changes in policy can partially mitigate the negative consequences of growing pressures on ecosystems, although the changes required are large and not currently under way
Examples of changes in policies and practices that yield positive outcomes • Global Orchestration • Major investments in public goods (e.g., education, infrastructure) and poverty reduction • Trade barriers and distorting subsidies eliminated • Adapting Mosaic • Widespread use of active adaptive management • Investment in education (countries spend 13% of GDP on education, compared to 3.5% today) • TechnoGarden • Significant investment in development of technologies to increase efficiency of use of ecosystem services • Widespread use of ‘payments for ecosystem services’ and development of market mechanisms
Responses – Importance of Indirect Drivers • Ecosystem degradation can rarely be reversed without actions that address one or more indirect drivers of change: • population change (including growth and migration) • change in economic activity (including economic growth, disparities in wealth, and trade patterns) • sociopolitical factors (including factors ranging from the presence of conflict to public participation in decision-making) • cultural factors • technological change • Collectively these factors influence the level of production and consumption of ecosystem services and the sustainability of the production.
Promising Responses • Institutions • Integration of ecosystem management goals within other sectors and within broader development planning frameworks • Increased transparency and accountability of government and private-sector performance • Economics • Elimination of subsidies that promote excessive use of ecosystem services (and, where possible, transfer these subsidies to payments for non-marketed ecosystem services) • Greater use of economic instruments and market-based approaches in the management of ecosystem services (where enabling conditions exist)
Promising Responses • Technology • Promotion of technologies that enable increased crop yields without harmful impacts • Restoration of ecosystem services • Promotion of technologies to increase energy efficiency and reduce greenhouse gas emissions • Social and Behavioral • Measures to reduce aggregate consumption of unsustainably managed ecosystem servicesCommunication and education • Empowerment of groups dependent on ecosystem services • Knowledge • Incorporation of nonmarket values of ecosystems in resource management decisions • Enhancement of human and institutional capacity
Summary • Over the past 50 years, humans have changed ecosystems more rapidly and extensively than in any comparable period of time in human history, largely to meet rapidly growing demands for food, fresh water, timber, fiber and fuel • The changes that have been made to ecosystems have contributed to substantial net gains in human well-being and economic development, but these gains have been achieved at growing costs in the form of the degradation of many ecosystem services, increased risks of nonlinear changes, and the exacerbation of poverty for some groups of people • The degradation of ecosystem services could grow significantly worse during the first half of this century and is a barrier to achieving the Millennium Development Goals • The challenge of reversing the degradation of ecosystems while meeting increasing demands for their services can be partially met under some scenarios that the MA has considered but these involve significant changes in policies, institutions and practices, that are not currently under way
Visit the MA Website www.MAweb.org • All MA reports available to download • Access to core data • MA ‘outreach’ kit • Slides • Communication tools