Download
1 / 7
70 likes | 189 Views
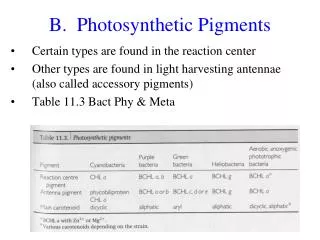
Photosynthetic parameters Marcel Babin. measured variables. Photosynthetic parameters derived from P vs. E (14C) curves (10 depths, 1L) Parameters derived from measurements of variable fluorescence : discrete samples : PAM (10 depth, 100ml) in situ measurements: FRRF. P max.

E N D
measured variables • Photosynthetic parameters derived from P vs. E (14C) curves (10 depths, 1L) • Parameters derived from measurements of variable fluorescence : • discrete samples : PAM (10 depth, 100ml) • in situ measurements: FRRF
Pmax P (mg C m-3 h-1) a Ek PAR (mole Quanta m-2 s-1) Fc = P / 12 (PAR . a) a= absorption coefficient m-1 mole C mole Quanta-1 P vs E curve P = Pmax tanh(PAR /Ek) Ek = Pmax /a Fcmax = a / 12 a
PROSOPE Bruyant, 2002
a* aB PBmax FCmax m2 mg Chla-1 mg C mg Chla-1 h-1 mg C mg Chla-1 h-1 mole Quanta m-2 s-1 mole C mole quanta micro 0.105 ± 0.660 0.020 ± 0.002 7.27 ± 0.66 0.125 nano 0.046 ± 0.004 0.021 ± 0.001 2.33 ± 0.24 0.051 pico 0.017 ± 0.005 0.037 ± 0.001 0.47 ± 0.29 0.011 R2 = 0.72 R2 = 0.91 R2 = 0.73 n = 344 n = 344 n = 344 Photo-physiological parameters might be dependant on phytoplankton community composition (POMME results)
Main hypothesis to be tested on BIOSOPE : Is the efficiency of carbon fixation dependant on the taxonomic groups (size) which are present (large phytoplankton more efficient than small one)? • More easy to parameterise than a dependence on environmental variables (T°, Nutrient and light) • Potential applications for bio-optical models • Besides P vs E measurements : Absorption, HPLC pigments, and 14C primary production (other approach to test the dependence of carbon fixation efficiency on taxonomic composition)
PSIIred Fm Fv PSIIox Fo 0 Parameters deduced from variable fluorescence measurements on discrete samples and in situ. fPS2 = (Fm – Fo ) / Fm sPS2