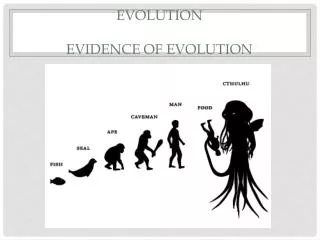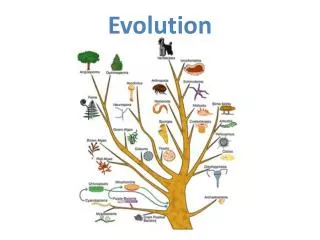
Evolution
Evolution. Conference Symposium. Topic idea and potential papers – 1% Annotated bibliography of 6 related papers – 10% Presentation – 12% Question – 2%. BIOL 4140 Evolution Symposium. Symposium Instructions.


Evolution
E N D
Presentation Transcript
Conference Symposium Topic idea and potential papers – 1% Annotated bibliography of 6 related papers – 10% Presentation – 12% Question – 2% BIOL 4140 Evolution Symposium
Symposium Instructions Overview: The course will culminate with a 3-week long exploration of cutting edge evolutionary research in the form of a scientific conference symposium. Each student will “become” a leading researcher studying evolution and will present a paper from the last two years (2012-current) as that researcher. This will require an in-depth exploration of the current literature and particularly work published by that researcher, as you will be drawing upon previous work from that researcher (and perhaps through perusing their website or through discussions with the researcher, discussing future directions). Provide me with your focal paper AND QUESTION 1 week prior to your talk Annotated bibliography due the day of the talk (focal paper counts as one of the 6 papers) You have 12 minutes for your talk, followed by 3 min of Q&A. All research must be presented “in character” as the focal researcher
Question Describe how results from stable isotope analysis conducted by Reudink et al. helped inform their understanding of the genetic structure of American white pelicans.
Multiple stable-isotopes (δD, δ13C, δ15N) indicate long-distance dispersal facilitates gene flow and genetic panmixia in a continentally-distributed waterbird Matt Reudink, R.L.F. Reudink, C. J. Kyle, R. A. Oomen, M.C. Green, C.M. Somers, T.K. Kyser, J.J. Nocera. In Review. Peerage of Science.
Goal: Create a range-wide profile of American white pelicans to track movement between years using: Utikuma Lake, AB • Microsatellites • mtDNA • Isotopes (C, N, H) Portage Lake, AB Pelican Lake, AB Stum Lake, BC Dore Lake, SK Last Mountain Lake, SK Pipestone Rocks, MB Akimiski, ON Boles Island, Mt. St. John, Ombabika, ON Lake of the Woods, ON Granite Island, ON Chase Lake, ND Welcome Islands, ON Medicine Lake, MT Clear Lake, CA Marsh Lake, MN LaCreek, SD Blackfoot NWR, ID Anaho Island, NV Bitter Lake, SD Gunnison Island, UT Padre Island, TX
Sample collection Feathers, blood
mtDNA 812 bp control region, n = 367 pelicans AMOVA, SAMOVA, MrBayes, FaBox, Network, etc. Microsatellites 10 microsatellites, n = 333 pelicans STRUCTURE, GENECLASS, TESS, etc. Historic Contemporary
Microsatellites - expected results ~100% to cluster 1 East continental divide 33% 33% Assignment probability to each cluster 33% West South ~100% to cluster 3 ~100% to cluster 2
Microsatellites - complete panmixia East continental divide 33% 33% Assignment probability to each cluster 33% West South Reudink et al. 2011 (Biol. J. Linnean Soc.)
mtDNA - complete panmixia again Oomen et al. 2011 (J. Heredity)
Goal: Create a range-wide profile of American white pelicans to track movement between years using: Utikuma Lake, AB • Microsatellites • mtDNA • Isotopes (C, N, H) Portage Lake, AB Pelican Lake, AB Stum Lake, BC Dore Lake, SK Last Mountain Lake, SK Pipestone Rocks, MB Akimiski, ON Boles Island, Mt. St. John, Ombabika, ON Lake of the Woods, ON Granite Island, ON Chase Lake, ND Welcome Islands, ON Medicine Lake, MT Clear Lake, CA Marsh Lake, MN LaCreek, SD Blackfoot NWR, ID Anaho Island, NV Bitter Lake, SD Gunnison Island, UT Padre Island, TX
Isotopic structuring Hydrogen - latitude Carbon - habitat Nitrogen – trophic position
dD r2 = 0.12 p < 0.0001 Without Texas: r2 = 0.03, p = 0.02 d13C r2 = 0.20, p < 0.0001 Without Texas: r2 = 0.03, p = 0.02 d15N r2 = 0.01, p = 0.28 Latitude
Linear Discriminant Analysis with leave-one-out cross-validation: Colony Level: Only 36% of samples correctly assigned back to the colony from which they were sampled (success rate: 0-78%) Regional (east/west/south) Level: 75% of samples correctly assigned, but heavily dependent on location (east: 93%, west: 19%, south: 78%) How well can we assign feathers back to their source?
Special thanks to all the pelican researchers who contributed time, energy, and samples to the project: M. Sovada, K. Tribby, S. Comeau-Kingfisher, A. McGregor, B. Madden, D. Mauser, D. Withers, M. Wackenhut, J. DiMatteo, J. Laux, D. Anderson, D. Wilson, J. Neil, M. Ball, S. Lockhart, N. Gorman, L. Dowling, R. Cobb, Z. Holderby, M. Biel, D. Newstead, W. Howe, and numerous field assistants. Funding: Climate Change Fund for Ontario, Explorer’s Club, MITACS, NSERC, Saskatchewan MOE, CWS, Northern Scientific Training Program, Canada Research Chair Program References 1. Reudink, M.W., C.J. Kyle, J.J. Nocera, R.A. Oomen**, M.C. Green, and C.M. Somers. 2011. Range-wide panmixia despite apparent ecological and behavioural barriers to gene flow in a widely-distributed waterbird. Biological Journal of the Linnean Society 102: 583-592. 2. Oomen, R.A.**, M.W. Reudink, J.J. Nocera, C.M. Somers, M.C. Green, and C.J. Kyle. 2011. Mitochondrial evidence for panmixia despite perceived barriers to gene flow in a widely distributed waterbird. Journal of Heredity. 102: 584-592.