Download
1 / 37
380 likes | 438 Views
This guide delves into the intricate world of parametric and factorial designs in research methodologies, exploring their significance, definitions, and practical applications using temporal basis functions and correlated regressors in data analysis. Learn the differences, advantages, and appropriate uses of each design type, with detailed insights on specifying in SPM, linear vs. non-linear effects, and orthogonalization techniques.

E N D
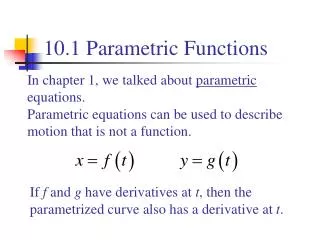
Parametric modulation, temporal basis functions and correlated regressors Mkael Symmonds Antoinette Nicolle Methods for Dummies 21st January 2008
Outline • Parametric regressors: When are they useful? • Parametric regressors: What do they mean? • How to specify in SPM • Linear and non-linear effects • Correlations between regressors and orthogonalisation
Parametric Design vs Factorial Design ON / OFF, 2 LEVELS Factorial design: • Experimental task has different factors that are independently manipulated. • Each factor may take several levels. • Events corresponding to each level of every factor are explicitly modelled by their own column in the design matrix. • Assumes that each cell of the design matrix is homogeneous and that stimuli differ only with regard to a single aspect across different levels of an experimental factor. • Can test for categorical or parametric effects and interactions by appropriate selection of contrasts to isolate one cognitive process at a time.
Parametric Design vs Factorial Design 1,2,3,4,5 – MANY LEVELS OR CONTINUOUS Factorial design: • Experimental task has different factors that are independently manipulated. • Each factor may take several levels. • Events corresponding to each level of every factor are explicitly modelled by their own column in the design matrix. • Assumes that each cell of the design matrix is homogeneous and that stimuli differ only with regard to a single aspect across different levels of an experimental factor. • Can test for categorical or parametric effects and interactions by appropriate selection of contrasts to isolate one cognitive process at a time.
Parametric Design vs Factorial Design Parametric design: • Every factor or variable has its own column in the design matrix – corresponding to one (independent) stimulus dimension of interest. • Different levels of the factor, or the (continuous) variable are represented numerically within one column. • Complex stimuli with a number of stimulus dimensions can be modelled by a set of parametric regressors tied to the presentation of each stimulus (e.g. faces can be described in terms of attractiveness, masculinity, symmetry, etc). • This means that: • 1. Statistical tests on the main effect of the condition (face presentation) will not be biased by variance within the condition due to systematic changes in the different stimulus dimensions increase in power • 2. Can look at the contribution of each stimulus dimension independently • 3. Can test predictions about the direction and scaling of BOLD responses due to these different dimensions.
Time (scans) Regressors: 1 2 3 4 mean Parametric Design vs Factorial Design Example: Very simple motor task - Subject presses a button then rests. Repeats this four times, with an increasing level of force. Hypothesis: We will see a linear increase in activation in motor cortex as the force increases Model: Factorial - regressor for each level of force of button press
Regressors: 1 2 3 4 mean Parametric Design vs Factorial Design Example: Very simple motor task - Subject presses a button then rests. Repeats this four times, with an increasing level of force. Hypothesis: We will see a linear increase in activation in motor cortex as the force increases Model: Factorial - regressor for each level of force of button press Contrast: 1 2 3 4 0 appropriate test to search for a linear increase? Time (scans)
Regressors: 1 2 3 4 mean Parametric Design vs Factorial Design Example: Very simple motor task - Subject presses a button then rests. Repeats this four times, with an increasing level of force. Hypothesis: We will see a linear increase in activation in motor cortex as the force increases Model: Factorial - regressor for each level of force of button press Contrast: -3 -1 1 3 0 No – need to mean-correct to look for differences between regressors that can be accounted for by a model of linearly increasing activation Time (scans)
Time (scans) Regressors: press force mean Parametric Design vs Factorial Design Example: Very simple motor task - Subject presses a button then rests. Repeats this four times, with an increasing level of force. Hypothesis: We will see a linear increase in activation in motor cortex as the force increases Model: Parametric - regressor for each level of force of button press Contrast: 1 0 0 Main effect of button pressing Time (scans)
Time (scans) Regressors: press force mean Parametric Design vs Factorial Design Example: Very simple motor task - Subject presses a button then rests. Repeats this four times, with an increasing level of force. Hypothesis: We will see a linear increase in activation in motor cortex as the force increases Model: Parametric - regressor for each level of force of button press Contrast: 0 1 0 Linear effect of force Time (scans)
Time (scans) Regressors: press force (force)2 mean Parametric Design vs Factorial Design Example: Very simple motor task - Subject presses a button then rests. Repeats this four times, with an increasing level of force. Hypothesis: We will see a linear increase in activation in motor cortex as the force increases Model: Can look at non-linear parametric effects by adding in a column Contrast: 0 0 1 0 Quadratic effect of force Time (scans)
Parametric Design vs Factorial Design Factorial design: • OK for simple design with limited number of levels of each factor. • But need lots of regressors if many levels – hard to handle • If your variables of interest vary over a continuous range, it is better to model this as a regressor with continuous values Parametric design: • Good for designs with continuous variables where you want to perform a multiple-regression type of analysis • Correlated regressors can cause problems with interpretation. • Not as straightforward to look at interactions between factors
Specifying parametric regressors in SPM To look at higher-order effects
Parametric vs Factorial Design – a real example • Correlation of presentation rate of spoken words with neural activity • Randomly vary the rate of presentation of words between 10 and 90 words per min Categorisation of different forms of rate-dependent responses Buchel et al, Neuroimage 1998
Parametric vs Factorial Design – a real example Zeroth order – main effect of word presentation First order – linear effect of presentation rate Second order – quadratic effect of presentation rate Demonstration of regionally specific word rate-dependent timecourses Buchel et al, Neuroimage 1998
Example of correlated regressors • Experiment: • Which areas of the brain are active in reward processing? • Subjects press a button to get a reward when they spot a red dot amongst green dots • General Linear Model: Y = β1X1 + β2X2 + ε Y = BOLD response X1 = button press (movement) X2 = response to reward
Example of correlated regressors Question: Which areas of the brain are active in reward processing? • The regressors are linearly dependent (temporally correlated - colinear), so variance attributable to an individual regressor (reward) may be confounded with another regressor (button press). • As a result we don’t know which part of the BOLD response is explained by movement and which by response to getting a reward • This may lead to misinterpretations of activations in certain brain areas • E.g. primary motor cortex involved in reward processing?? • We can’t answer our question…..
How do I deal with it? • Avoid the problem by careful design of your experiment. • Can use toolboxes “Design Magic” - Multicollinearity assessment for fMRI for SPM. URL: http://www.matthijs-vink.com/tools.html The only way you can avoid correlated regressors in a factorial design is to deliberately construct your experimental manipulations so that they are independent (orthogonal)
How do I deal with it? • Avoid the problem by careful design of your experiment. • Can use toolboxes “Design Magic” - Multicollinearity assessment for fMRI for SPM. URL: http://www.matthijs-vink.com/tools.html You can check for colinearity/orthogonality in SPM
How do I deal with it? • Imagine you are trying to explain data point y in terms of vector x1 y = 1X1 1 = 1.5 y x1
How do I deal with it? • Adding in x2 changes the beta value of x1, as now x2 can explain some of the variance (a linear combination of x1 and x2 perfectly explain y) y = 1X1 +2X2 1 = 1 2 = 1 y x2 x1 You have changed your inference about x1 by adding in another correlated regressor
How do I deal with it? • To look at how much of y is purely explained by x1, need to ‘orthogonalise’ x2 y = 1X1 +2*X2 * 1 = 1.5 2 * = 1 y x2 x2* x1
How do I deal with it? • SPM will automatically do serial orthogonalisation (note that this is only within each condition, so for each condition and its associated parametric modulators) y = 1X1 +2*X2 * 1 = 1.5 2 * = 1 y x2 x2* x1 We now have greater power to explain y in terms of x1 + x2 with no residual error – improves our conclusions about x1
How do I deal with it? • Parametric regressors are orthogonalised from left to right in the design matrix automatically by SPM • Order in which you put parametric modulators is important!!! • Put the ‘most important’ modulators first (i.e. the ones whose meaning you don’t want to change)
Summary • Use parametric modulators to investigate the effect of varying levels of a stimulus independently from the main effect of presenting the stimulus • Can also look at non-linear effects • Need to be aware of problems with inference due to correlated regressors • Parametric modulators are serially orthogonalised in SPM
Thanks to… • Rik Henson’s slides: www.mrc-cbu.cam.ac.uk/Imaging/Common/rikSPM-GLM.ppt • Previous years’ Presentations • H Spiers, A Liston, H den Ouden, E Chu, and previous • Additional references • ‘Characterizing stimulus-response function using nonlinear regressors in parametric fMRI experiments’, Buchel et al, Neuroimage, 1998 • ‘Using parametric regressors to disentangle properties of multi-feature processes’, Wood et al, Behavioural and Brain Functions, 2008
Temporal Basis Functions Methods for Dummies 21st Jan 2009 Antoinette Nicolle
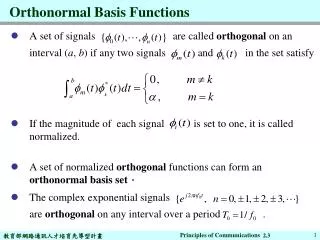
What’s a basis function then…? • In linear algebra, a basis is used to describe a point in space. • A basis function is the combining of a number of functions to describe a more complex function. f(t) h1(t) h2(t) h3(t) Fourier analysis The complex wave at the top can be decomposed into the sum of the three simpler waves shown below. f(t)=h1(t)+h2(t)+h3(t)
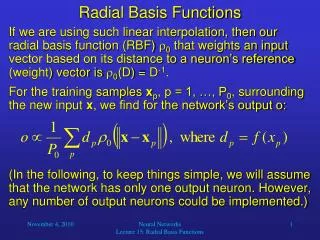
Temporal Basis Functions for fMRI • In fMRI we need to describe a function of % signal change over time. • There are various different basis sets that we could use to approximate the signal. Finite Impulse Response (FIR) Fourier
Temporal Basis Functions for fMRI • Better though to use functions that make use of our knowledge of the shape of the HRF. • One gamma function alone provides a reasonably good fit to the HRF. They are asymmetrical and can be set at different lags. • However they lack an undershoot. • If we add two of them together we get the canonical HRF.
Limits of HRF • General shape of the BOLD impulse response similar across early sensory regions, such as V1 and S1. • Variability across higher cortical regions. • Considerable variability across people. • These types of variability can be accommodated by expanding the HRF in terms of temporal basis functions.
“Informed” Basis Set (Friston et al. 1998) Canonical HRF (2 gamma functions) plus Multivariate Taylor expansion in: time (Temporal Derivative) width (Dispersion Derivative) The temporal derivative can model (small) differences in the latency of the peak response. The dispersion derivative can model (small) differences in the duration of the peak response.
Comparison of the fitted response These plots show the haemodynamic response at a single voxel. The left plot shows the HRF as estimated using the simple model. Lack of fit is corrected, on the right using a more flexible model with basis functions.
Left Right Mean 1 0 0 -1 0 0 0 Putting them into your design matrix
Thanks to… • Rik Henson’s slides: www.mrc-cbu.cam.ac.uk/Imaging/Common/rikSPM-GLM.ppt • Previous years’ presenters’ slides • Guillaume Flandin