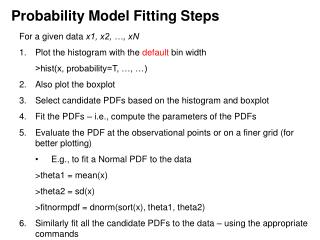
Visual Model Fitting Techniques and Methods for Curve Fitting
Learn about interpolation, polynomial fitting, cubic splines, and least squares curve fitting for accurate data modeling. Understand practical applications and strengths of curve fitting methods.

Visual Model Fitting Techniques and Methods for Curve Fitting
E N D
Presentation Transcript
MODEL FITTING jiangyushan
Introduction The goal of model fitting is to choose values for the parameters in a function to best describe a set of data. There are many possible reason to do this. If a specific meaningful form for the function with a small number of free parameters is known in advance, this is called parametric fitting, and finding the parameter values themselves may be the goad (for example, measuring an exponential decay constant to determine a reaction rate).
Visual Model Fitting with the Original Data Suppose we want to fit the model to the data shown in Fig2.1. How might we choose the constants and to determine the line that best fits the data? Generally, when more than two data points exist, all of them cannot be expected to lie exactly along a single straight line, even if such a line accurately models the relationship between the two variables . Fig2.1
Interpolation • The most straightforward way to fit a curve to the data D is to find a function f that passes through each of the n data points or samples. That is , find a function f such that Once a function is determined that satisfies (2.1) ,the value of y at other points can be estimated. In this case, the process of estimating y is referred to as interpolation.
Main Method for Interpolation and Curfitting Piecewise-Linear Interpolation Polynomial Interpolation Lagrange Interpolating Polynomials Newtons’s Difference Formula Cubic Splines Chebyshev Approximation Criterion Least squares curvefiting
Matlab Functions • poly,interp1,spline, pchip, polyfit, polyval • Lsqnonlin, lsqcurvefit, regress, nlinfit
Piecewise-Linear Interpolation interp1 1-D data interpolation (table lookup) Syntax yi = interp1(x,Y,xi) yi = interp1(Y,xi) yi = interp1(x,Y,xi,method) yi = interp1(x,Y,xi,method,'extrap') yi = interp1(x,Y,xi,method,extrapval) pp = interp1(x,Y,method,'pp') Description yi = interp1(x,Y,xi) interpolates to find yi, the values of the underlying function Y at the points in the vector or array xi. x must be a vector. Y can be a scalar, a vector, or an array of any dimension.
Visual Model Fitting with the Original Data Ordinarily, there will be some vertical discrepancy between a few of the data points and any particular line under consideration. We refer to these vertical discrepancies as absolute deviations (Fig 2.2). For the best-fitting line, we might try to minimize the sum of these absolute deviations, leading to the model depicted in Fig2.2. Although success may be achieved in minimizing the sum of the absolute deviations, the absolute deviation from individual points may be quite large. For example, consider point D in Fig2.2. If the modeler has confidence in the accuracy of this data point, there would be concern for the predictions made from the fitted line near the point. As an alternative, suppose a line is selected that minimizes the largest deviation from any point. Applying this criterion to the data points might give the line shown in Fig2.3.
Visual Model Fitting with the Original Data Absolute deviation Fig2.2 minimizing the sum of these absolute deviations from the fitted line Fig2.3 minimizing the largest absolute deviations from the fitted line
lsqcurvefit • x = lsqcurvefit(fun,x0,xdata,ydata) • Solve nonlinear curve-fitting (data-fitting) problems in least-squares sense • Equation:Find coefficients x that best fit the equation • given input data xdata, and the observed output ydata, where xdata and ydata are matrices or vectors of length n, and F (xdata) is a matrix-valued or vector-valued function.
Objectives • Understand the difference between interpolation and curvefitting • Know how to express piecewise-linear interpolation parametrically • Know why interpolation with high-degree polynomials is undesirable • Known why finding the interpolating polynomial by solving a linear algebraic system can be inaccurate.
Objectives • Know how to construct and use Largrange interpolating polynomials to perform interpolation • Be able to fit curves to the underlying trend of data using least-squares techniques. • Understand how curve fitting techniques can be used to solve practical engineering problems. • Understand the relative strengths and weaknesses of each computational method and know which are most applicable for a given problem.
The growth of a population of fruit flies The following data represent the growth of a population of fruit flies over a 6-week period. Test the following models by plotting an appropriate set of data. Estimate the parameters of the models: