
Expression Levels of Neurotrophic Factors in Ischemic Brain Post-Transplantation of NPCs and MSCs
This study investigates the expression levels of neurotrophic factors in the ischemic brain after transplantation of NPCs, PSA-NCAM+, MSCs, or PBS at day 26. RT-PCR was utilized to assess these levels, comparing them to sham controls for normalization. The data, represented in a bar graph format, indicates significant differences in neurotrophic factor expression, with results showing mean values ± S.E.M. A significant increase was observed in the group receiving NPCs or MSCs compared to the PBS control group, with *P < 0.05 highlighting statistical relevance.

Expression Levels of Neurotrophic Factors in Ischemic Brain Post-Transplantation of NPCs and MSCs
E N D
Presentation Transcript
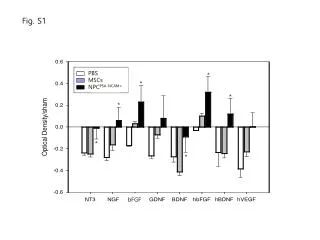
Fig. S1 PBS MSCs NPCs * * * * * PBS MSCs NPCPSA-NCAM+ * bFGF
Fig. S1 The expression levels of rat and human neurotrophic factors in ischemic brain were assessed using RT-PCR at day 26 after transplantation with NPCPSA-NCAM+, MSCs or PBS. A representative RT-PCR amplification of neurotrophic factors and the quantification of GAPDH-normalized mRNA levels to that of sham controls (baseline) (n=3 per group) are shown. Values are mean ± S.E.M. *P<0.05 when compared to those of PBS group.


![[Fig. S1]](https://cdn3.slideserve.com/6448662/slide1-dt.jpg)


