Download
1 / 12
120 likes | 259 Views
Benchmarks for Public Reports. Ernest Moy Ernest.moy@ahrq.hhs.gov 301-427-1329 www.ahrq.gov/qual/qrdr11.htm http://statesnapshots.ahrq.gov. National Healthcare Reports. Happy 9 th Birthday. Institute of Medicine Recommendations.

E N D
Benchmarks for Public Reports Ernest Moy Ernest.moy@ahrq.hhs.gov 301-427-1329 www.ahrq.gov/qual/qrdr11.htm http://statesnapshots.ahrq.gov
Institute of Medicine Recommendations • Align the NHQR and NHDR with nationally recognized priority areas. • Select measures that reflect health care attributes or processes that are deemed to have the greatest impact on population health. • Affirm that achieving equity is an essential part of quality improvement. • Increase the reach and usefulness of AHRQ’s family of report-related products. • Analyze and present data in ways that will inform policy and promote best-in-class achievement for all actors. • Identify measure and data needs to set a research and data collection agenda.
IOM Recommendation 7 • The reporting of each measure in the NHQR and NHDR measure set should include routinely updated benchmarks that represent the best known level of performance that has been attained. Too High Just Right Too Low
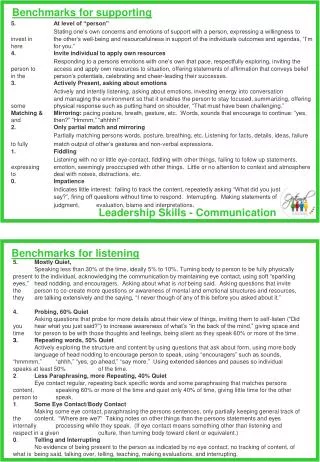
Benchmark Methods • Setting Achievable Benchmarks of Care • Same in QR and DR • Top 10% States • 30+ States with reliable estimates • Exclude Territories • Reset when achieved overall • Calculating Time to Benchmark • Linear regression of data points • 4+ data points make a trend (or change in trend)
ABC Ex.: Pneumococcal Vaccine among Elderly by Race/Ethnicity Time to Benchmark 2008 Achievable Benchmark = 63.9% 2 yrs 8 yrs 14 yrs 87 yrs
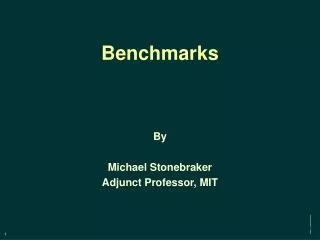
ABC Example: Screening Lower Endoscopy by State Time to Benchmark 2008 Achievable Benchmark = 72.5% ½ yr 5 yrs MD US
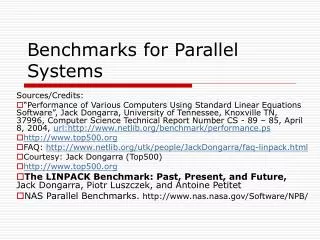
Progress in State Snapshots: Michigan No. 14 / 17 / 11 / 27 Every State performs well in some areas and poorly in others.
PA has more racial/ethnic, fewer income-related disparities.
Conclusions • Benchmarks are critical in public reports • Spur quality improvement & disparities reduction • Provide realistic targets & standards for comparison • Methods can be complex • Future work: More benchmarks for disparities • Race/Ethnicity • Insurance • Other?