Download
1 / 25
250 likes | 460 Views
Lane County 20-Year Coordinated Population Forecast Project Kick-off Public Meeting December 2, 2008. Population Forecasting Techniques Presentation by Population Research Center Project Team. Population Research Center Project Team. Risa Proehl, Project Lead

E N D
Lane County 20-Year Coordinated Population Forecast ProjectKick-off Public MeetingDecember 2, 2008 • Population Forecasting Techniques • Presentation by • Population Research Center • Project Team
Population Research Center Project Team • Risa Proehl, Project Lead • Danan Gu, Demographic Analyst • Ken Radin, GIS Analyst • George C. Hough Jr., Director
Population ForecastsProcess • Develop Demographic Models Using Historic and Recent Data • Analyze Past and Recent Population Trends - Reasons for Change, Continuous or Short-term? • Gather Information About Recent and Planned Future Housing and Population change (housing developments, construction of new GQ facilities, new employers) • Make Assumptions About Future Housing and Population Change • Revise Forecasts on a Regular Basis
Outline • Population Trends – Lane County • Population Projection Methods • Assumptions About the Future
Population Change in Lane County • Lane County Grew Consistently 1900 to 2008 • Lane County Grew in Absolute and Relative Reflecting Societal/Economic Conditions • Lane County Population Change Has Shifted from High Growth Scenario of 3% per year to about 1% per annum • The Eugene and Springfield Shares of County Population Increased but Have Become More Stable in Recent Years
Population Change 1900 to 2008 Reflects Decade Economic ChangesHigher Growth and Lower Growth Periods
Population Projection TechniquesPrimary Models for this Study COHORT-COMPONENT METHOD for Lane County, Eugene, Springfield Relies on Age-Sex Schedules of Demographic Behavior Population Pyramid Displays Age Structure Mortality – Fairly Constant over Time Fertility – Decreased Teen Fertility, Older Mothers and Latino Births Migration – In Lane Co., Mostly Influenced by Common College Pattern and Employment Availability Migration Rates Subject to Greater Fluctuation than Mortality and Fertility and more unpredictable Three Scenarios of Growth: High, Medium, Low
Age Schedules of Fertility, Mortality and Migration Determine the Age Structure of a Population Males Females Population Distribution, Lane County, 1990 and 2000 Population
Population Projection TechniquesPrimary Models for this Study, con’t. • HOUSING UNIT METHOD • for Ten Smaller Cities, Unincorporated Area, Area Outside UGBs • Housing Unit Growth – Trend Actual, Trend County Shares • Housing Unit Type (single-/multi-family) • Household Composition – Persons • Persons Per Household • Occupancy Rates • Add Group Quarters Population • Based on Medium Growth Scenario – one scenario as smaller areas have more variability than larger areas • Controlled to Cohort-Component Model Results for County
Housing Unit Method, con’t. • Fluctuations in housing unit growth follows economic trends with Exceptions • PPH • Factors that influence PPH: Race/Ethnicity, Age (fertility), Economy • Generally Decreasing in U.S. • Occupancy Rates - Seasonal Housing • Ranges from 79% to 95% • Group Quarters Population Ranges from 0% to 5% of Total Population • Doesn’t Fluctuate Greatly (unless new facility built or closed)
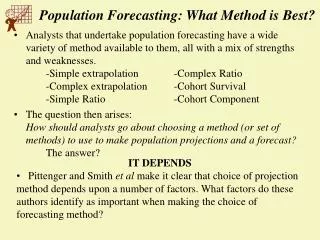
Population Projection Techniques Other Models/Techniques to Consider for All Areas in this Study • For Comparison and to Serve as a Check • Shift-Share and Other Ratio Methods • Trend Extrapolation • Simple Economic/Employment Model • Land Use and Capacity • Additional Housing Unit Models (in addition to CC models)
Data • Background Information • Some Entered Directly into Projection Models • Some Provide Support for Assumptions Made for Future Change • All Data Available for Lane County, Many Available for Individual Cities (Census, Land Use, Housing, Births, Group Quarters Population)
Data Data Sources 1990 and 2000 Census Data ACS Data – post-2000 Vital Statistics Building Permit Data Annual Housing and Population Data from Local Jurisdictions PRC Annual Population Estimates, post-2000; Revised to Current Boundaries and UGBs School Enrollment Data Land Use Data and Plans for Future Development Local Studies – e.g., School Enrollment Projections, Previous Coordinated Plans, TSP Employment and Labor Force Data and Projections Previous OEA/DAS–County Projections to 2040 Confer with OEA about Current and Revised Forecast Information from local Government Staff, Public Meetings
Future Conditions and Considerations • Assumptions are Based on Past and Recent Trends, Occurrence of Events, and Plans for Future Housing • Future Assumptions for Lane County? • Mortality – Slight Increase in Longevity • Fertility – Slightly Older Mothers and Latino Births • Migration – Employment and Group Quarters Populations • Assumptions about PPH, Vacancy Rates, Housing Construction • Some Current Conditions are Assumed to be the Same in Future (e.g. land use zoning, residential densities, UGBs expand as needed) • Citizen and Governmental Input Combined with Demographic Expertise Will Produce the Most Reasonable or Likely Forecasts
Life Expectancy, Lane County, 1970-2035 Estimates after 2005 High: Assuming average annual increase rate from 1970-2005. Medium: Assuming average annual increase rate from 1990-2005. Low: Assuming average annual increase rate from 2000-2005. (Ann. Time Series)
Total Fertility Rate, Lane County, 1990-2035 Mean age at births, Lane County,1970-2035
Population Growth, Net Migration, Lane County, 1980-2005 Net migrate rate ( per 1,000) Population Year
Projections and ForecastsGeneral Comments Projections Are More Accurate in Short-Term The Larger the Geographic Area, The More Accurate the Projection Population Forecast is a Tool to Help with Planning and Serves as a Guide – not a Guarantee of What Will Occur Revisions to Forecasts Should be Made Regularly! PRC Utilizes Best Practices – Professional Associations