Population Forecasting using Geometric Increase Method
Population Forecasting using Geometric Increase Method. Presented by: Bhantooa Luvindraj (1014582) Boyjoo Manoj (1014504) Bundhoo Deepshika (1017841) Ramgoolam Oomeshnathsingh (1019085) Seburn Indra (1015380). Population Forecasting.

Population Forecasting using Geometric Increase Method
E N D
Presentation Transcript
Population Forecasting usingGeometric Increase Method Presented by: BhantooaLuvindraj (1014582) BoyjooManoj (1014504) BundhooDeepshika (1017841) RamgoolamOomeshnathsingh (1019085) SeburnIndra (1015380)
Population Forecasting Population Forecasting consists of mathematical models which are used to analyse changes in population numbers. There are several factors affecting changes in population: • Increase due to births • Decrease due to deaths • Increase/Decrease due to migration • Increase due to annexation All the above data can be obtained from the census population records.In Mauritius, these information can be obtained at the Central Statistics Office (CSO)
…Population Forecasting The various mathematical methods available are generally classified in two categories: Short term methods and Long term methods Short term methods (1-10 years) • Arithmetic progression • Geometric progression • Incremental increase method • Decreasing rate of growth • Simple graphical method Long term methods (10-50 years) • Comparative graphical method • Ratio method • Logistic curve method
Why is population forecasting important? • Population forecasting is an integral part of design. It is essential to take into account the population at the end of the design period. • Fundamental to planning (Assumptions and estimates used in determining sewage flow have a permanent effect on planning decisions and outcomes) • Premature and excessive investments in works • System failure and hence increasing customer complaints • Environmental impact • Essential to service provider so as to know the spare capacity of the system • Identification of weak links of systemAbility to accept new/unexpected demands
When can projections be carried out? Projections are likely to be carried out for the design of a system. A service provider should have knowledge of current demand/flow and anticipated future projections at all times.Projections should be determined: • Once the needs of the service are already known and the objectives determined • Stakeholder requirements have been identified • Adequate raw data on existing flows/demands is available
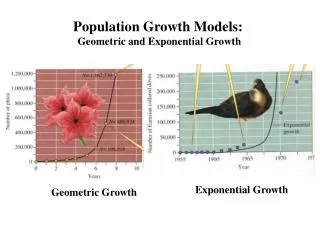
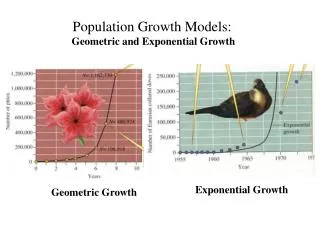
Geometric Increase Method The basic model for geometric change in population size is: P = Po λt which is based on the hypothesis that rate of change of population is proportional to the population. According to this, method it is assumed that the rate of increase of population growth in a community is proportional to the present population. • Po denotes initial size, • P denotes population at time t • t denotes time (measured in decades) • λ is the ‘finite population multiplier’ which can be interpreted as λ = ℮ifor continuous change or λ = 1+ i for discrete (constant) ‘compound interest’ or ‘birth-pulse’ populations.
ExamplePredict the population for the years 2023, 2033, and 2043 from the following census figures of a town using geometric method.
Solution 1. USINGDISCRETE METHOD (RATE OF CHANGE IS CONSTANT) P = Poλt λ = (1+ i) for discrete change Therefore P = Po (1+i)t where, P0 : Initial population size P: Population size at time t i: Average percentage increase per decade t: Number of decades
…Solution (using discrete method)Solution • Population for 2023 = Population 2013 x (1+i/100) t = 120 x (1+10.66/100), where i = 10.66, t = 1 = 120 x 110.66/100 = 132.8 • Population for 2033 = Population 2013 x (1+i/100) t = 120 x (1+10.66/100)2, where i = 10.66, t = 2 = 120 x 1.2245 = 146.95 • Population for 2043 = Population 2013 x (1+i/100) t = 120 x (1+10.66/100)3, where i = 10.66, t = 3 = 120 x 1.355 = 162.60
2. CONTINOUS METHOD (RATE OF CHANGE IS INCREASING) (When t = 0, P = Po, therefore c = ln Po)
…Solution (using continuous method) • P = Poλt • λ = ℮ i for continuous change • P0: Initial population size • P: Population size at time t • i: Average percentage increase per decade • t: Number of decades • The average rate of increase ‘i’ is calculated in the same way as for the discrete change.
…Solution (using continuous method) Population for 2023 = Population 2013 x e it = 120 x e(10.66/100 *1), where i = 10.66, t = 1 = 133.50 Population for 2033 = Population 2013 x eit =120 x e(10.66/100 *2), where i = 10.66, t = 2 =148.52 Population for 2043 = Population 2013 x e it =120 x e(10.66/100 *3), where i = 10.66, t = 3 =165.22
…solution (comparison of results) • In the graph, we can conclude that values obtained from the continuous method are higher than those obtained from the discrete method. This is because in the discrete method, the rate of increase of population is constant whereas the continuous method has an increasing rate of increase of population. • In order to calculate the population number for any other specific year within the decade, the same graph can be used.
Advantages of Geometric Progression • Geometric extrapolation is desirable for short intervals • Simple method • When forecasting for a new city • Geometric rates are preferable to arithmetic rates for the extrapolation of decreases in population over a series of years
Limitations of Geometric Progression • When the geometric rate of increase is high and the period of time is long • If the accuracy of the basic census figures is subject to considerable doubt • Where the death rate is declining while the birth rate remains nearly constant
Population Forecasting in the Design of Waste Water system Quantity of sewage at the end of a design period = Per capita production of sewage x Forecasted population at the end of the design period The quantity of wastewater generated per capita is estimated to be 80% of the water consumption per capita. The water consumption per occupant per day, for different institutions, can be obtained from the table
Conclusion In the light of the above, we can see that the Geometric Increase Method is a simple realistic population model based on past information. This method tends to give a higher estimate than normal since it behaves exponentially. It more accurately describes the continuous and cumulative nature of population growth. In normal practice, an average of the arithmetic method and geometric method is performed to get a more accurate estimate.