Download
1 / 42
420 likes | 776 Views
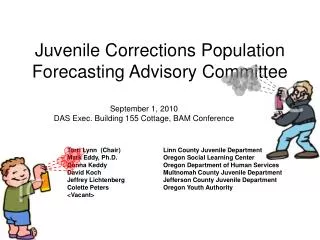
Juvenile Corrections Population Forecasting Advisory Committee. September 1, 2010 DAS Exec. Building 155 Cottage, BAM Conference. Torri Lynn (Chair) Linn County Juvenile Department Mark Eddy, Ph.D. Oregon Social Learning Center Donna Keddy Oregon Department of Human Services

E N D
Juvenile Corrections Population Forecasting Advisory Committee September 1, 2010 DAS Exec. Building 155 Cottage, BAM Conference Torri Lynn (Chair) Linn County Juvenile Department Mark Eddy, Ph.D. Oregon Social Learning Center Donna Keddy Oregon Department of Human Services David Koch Multnomah County Juvenile Department Jeffrey Lichtenberg Jefferson County Juvenile Department Colette Peters Oregon Youth Authority <Vacant>
Welcome, Introductions (Torri, Damon) • Review July 29 small group meeting (Torri) • Progress on demand using community youth (Damon) • Population trends, Forecast tracking (Damon) • Roundtable – Juvenile Justice Issues • Next Steps: October forecast, model work • Next meeting: Wednesday, September 22, 2010, 1:30 – 3:30 p.m. (same place)
Small Group Meeting Review • Met July 29, 2010 • Review of OYA data for 2005 – 2010 Parole and Probation Youth (felony adjudications) • Mirror population of high risk youth in communities closely resembling the risk population in YCF. • Group consensus that youth being supervised in the community by counties and OYA is a primary feeder into the YCF and should be part of the formula. • Goal for the full committee meeting was to run the previously unrepresented probation populations of youth supervised by both counties and OYA as part of the formula to determine the juvenile closed custody forecast.
Small Group Meeting Review • Follow-up Work, Progress: • New data needed/wanted: • Need county supervision – who, where, when, why. • Want new predictors: detention, probation violations • Want risk assessments: Damon is confused – JCP, RNA, etc. • Data received from OYA. (No good PV data.) • In progress: Development of model based on the community placements. • Most data work completed, but preliminary model not yet functional.
Concepts: Demand Using Community Youth • Current referral-based approach: • Drop in demand more than practitioners’ observations • Assessment of all criminal referrals • How can the model ‘see’ the practitioner viewpoint? • Kids on probation or parole - “community youth” • County or OYA supervision • … versus “anyone who’s ever been referred” • Risk pool • Cleaner: better defined, more consistent • More closely tied to actual behavior since reviewed • Keep until adult? • Handles repeat entries (half or more)
Concepts: Demand Using Community Youth • Potential Factors to Include • Referral information (same info as current) • Most recent referral • History of referrals for youth • Probation violations – no data • Detention episodes • Current supervision (esp. Parole)
Population Trends and Tracking • Close Custody Populations • PSR steadily reducing • DOC 2007 2008 increasing, 2009 2010 flat or slightly down • DOC and PSR Trends • DOC and PSR – actual beds vs. forecast • DCC population – demand index vs. forecast • Referrals
Population Trends and Tracking Close Custody Populations – past decade
Population Trends and Tracking Close Custody Populations – past decade
Population Trends and Tracking • Forecasts--- • DOC and PSR populations, forecast: • Following expected trends • Forecast: No significant change expected • Demand forecast • Based on demand index
Population Trends and Tracking DOC and PSR Populations – Long Term
Population Trends and Tracking DOC and PSR Populations – Actual, Forecast Error: +1.6% (Forecast is high by 6 beds) Error: +5% (Forecast is high by 4 beds)
Population Trends and Tracking • DCC: Discretionary bed demand forecast • Based on demand index (no actuals to compare) • Compare to changes in demand index • Demand from past forecasts • Demand index is down 15% since Jan. 2010 • Graphs: Demand index and other referral trends
Population Trends and Tracking DCC Demand (Discretionary Bed Demand)
Population Trends and Tracking DCC Demand and Number Referrals Monthly
Population Trends and Tracking DCC Demand and Felony Referrals
Population Trends and Tracking DCC Demand and Youths’ Past Felony Referrals
Population Trends and Tracking DCC Demand and Referral Trends
Roundtable • Juvenile Justice Issues • Observed Trends • …
Next Steps • Committee Decisions • October forecast • Determination of demand for discretionary • Continue work on community model?
Adjourn Meeting • Thank you • Please call or email with any other comments, ideas, issues, etc. • Torri Lynn 541-967-3853 • Damon Bell 503-378-5732 • Next Meeting: Wednesday, September 22 at 1:30 pm (same place)
Population Trends and Tracking Length of Stay for Releases N=53 N=23
Population Trends and Tracking Average Age in Population
THE FOLLOWING SLIDES ARE FROM THE FEBRUARY 24, 2010 COMMITTEE MEETING
Statistical SummariesDecade 2000 • Referrals (felony, misdemeanor, violation, other) • Population adjusted rate shows a stronger decline
Statistical SummariesDecade 2000 Felony Referrals
Statistical SummariesDecade 2000 Felony Referrals by Year and Class
Statistical SummariesDecade 2000 • Felony Referrals – Person Related / Other
Statistical SummariesDecade 2000 Felony Referrals – Person Related / Other Person Related: Sex Offense Assault Homicide Related Weapons Robbery Person Other Other: Arson Burglary Theft Criminal Mischief Substance/Alcohol Other 53% Drop 30% Drop
Statistical SummariesDecade 2000 Felony Referrals -- Race and Type 2000 2009 Other Person Related
Statistical SummariesDecade 2000 Misdemeanor Referrals • Violations/other are similar to misdemeanors referrals in overall number and in change from 2000 to 2009
Statistical SummariesDecade 2000 Misdemeanor Referrals by Year and Class
Juvenile Incarceration RateState Comparisons • Census of Juveniles in Residential Placement • http://ojjdp.ncjrs.gov/ojstatbb/cjrp/asp/State_Facility_Operation.asp • Number of committed juveniles – total • Includes state, local, public, private • Calculated Rate: number per 100,000 • Using ages 9-17 for denominator • http://ojjdp.ncjrs.gov/ojstatbb/ezapop/asp/comparison_selection.asp • Rates and change in rates: 1999 and 2006 “Includes juveniles in placement in the facility as part of a court-ordered disposition. Committed juveniles may have been adjudicated and disposed in juvenile court or convicted and sentenced in criminal court.” Sickmund, Melissa, Sladky, T.J., and Kang, Wei. (2008) "Census of Juveniles in Residential Placement Databook." Online. Available: http://www.ojjdp.ncjrs.gov/ojstatbb/cjrp/
Juvenile Incarceration RatesState Comparisons • Rate per 100,000 – Year 1999 311 213
Juvenile Incarceration RatesState Comparisons • Rate per 100,000 – Year 2006 232 173