Population Pyramids
Interpret population pyramids to reveal demographic trends. Explore expansive, stationary, and contractive shapes & their implications on birth, death rates, and standards of living. Learn how to read pyramids for insights on population structure.


Population Pyramids
E N D
Presentation Transcript
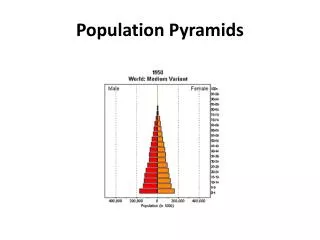
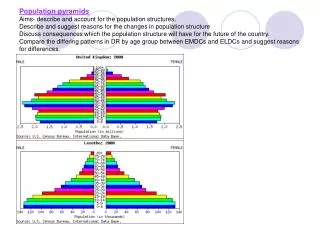
Population Pyramids Population pyramids are graphs that show the age structure of a population by age & gender
age categories are in 5 year increasing intervals labeled up the center axis Normally Males are on the left and females are on the right the horizontal axis is measured in millions
Classifying Population Pyramids Expansive or expanding Stationary or Stable Contractive or Contracting
Expansive or Expanding • These pyramids have this classic triangular/ pyramid shape. • The wide base of the population pyramid indicates a high birth rate and the narrow top indicates a high death rate.
Expansive or Expanding • Generally speaking an expanding population is characteristic of a lower standard of living. • High birth rate due to poor access to birth control, lack of education etc. • High death rate due to poor medical care and nutrition.
Stationary or Stable • These pyramids have an ½ ellipse shape • The base is similar in width to the population of the reproductive ages which indicates a stable population.
Stationary or Stable • Generally speaking stable populations are characteristic of a high standard of living due to... • Low birth rate due to good family planning, access to birth control, financial planning, education, ect. • Low death rate due to good medical care, nutrition education, ect.
Contractive or contracting • These pyramids have a narrower base than the reproductive age population. • This indicates a decreasing population trend. The low birth rate is indicative of a well developed country.
Reading Population Pyramids Observing different characteristics of the population pyramid can tell you a lot about the population. Width of the base: - A wide base indicates a high birth rate - A narrow base indicates a low birth rate
Reading Population Pyramids Symmetry - Statistically speaking, pyramids should be relatively symmetrical - This pyramid shows more females at the 85+ age range which indicates that women are living to older ages than males
Reading Population Pyramids Shape of sides - Concave sides indicate a high death rate and convex sides indicate a low death rate. - This pyramid exhibits concave sides indicating a high death rate.
Reading Population Pyramids Bumps in the sides: - Irregularities in the sides indicate a demographic anomaly - The 30-50 age group in this population pyramid represents the baby boom. - The bump will travel upward as the baby boomers age.