Population Pyramids
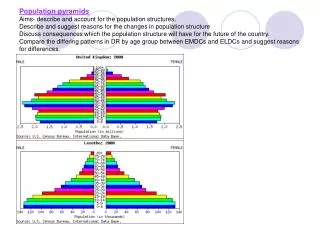
Population Pyramids. Patterns in Human Geography. What are Population Pyramids?. Population pyramids are a type of graph that give information about the number of people in each age group and the balance of males and females in a country’s population. Which country would you rather live in?.

Population Pyramids
E N D
Presentation Transcript
Population Pyramids Patterns in Human Geography
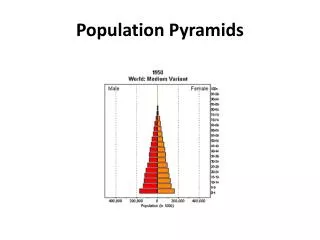
What are Population Pyramids? • Population pyramids are a type of graph that give information about the number of people in each age group and the balance of males and females in a country’s population.
Which country would you rather live in? Country B Country A
Which country would you rather live in? Japan Egypt
Pyramid Organization Rules • The pyramid is divided down the middle and males are shown on the left, females on the right. • Each graph is a series of horizontal bar graphs stacked on top of each other. • The youngest people in a society are shown at the bottom of the graph and the oldest people are at the top. • The pyramid may show the population as a percentage or in millions.
What are they used for? • Population pyramids are useful for studying issues related to the age and sex distribution of populations of different countries. • Number of males vs. females for particular age groups. • Number of old vs. young people. • The shape of the pyramid can tell us many things: • If the country is developed or developing. • If the country’s population is growing, stable, or shrinking
Developing Countries - Shape • These countries have lower GDPs, higher fertility and infant mortality rates.
Developed Countries - Shape • These countries have higher GDPs, lower fertility and infant mortality rates.
Growing Populations • In these countries the birth rate is higher than the death rate. • The wider the base is, the faster the population growth.
Stable Populations • In these countries the birth and death rates are equal, so there is no net population growth.
Decreasing Populations • In these countries, the birth rate is smaller than the death rate. The smaller the base, the more rapid the decrease.
Practice • Does the pyramid below show a country that is developed or developing? Is it growing?
Practice • Does the pyramids below show countries that are developed or developing? Are they growing?
Practice • Does the pyramid below show a country that is developed or developing? Is it growing?
Practice • Does the pyramid below show a country that is developed or developing? Is it growing?
Check this out! • Population Pyramids of the World: http://populationpyramid.net/