Download

1 / 22
220 likes | 279 Views
Explore the intricacies of population pyramids, visual representations offering insights into societies' age, gender, and growth characteristics. Learn to predict future trends based on different shapes like unstable, expanding, stable, stationary, or declining populations. Uncover the implications of birth rates, death rates, life expectancy, and other key factors influencing a country's demographic outlook.

E N D
Population Pyramids A Scaffolded Analysis
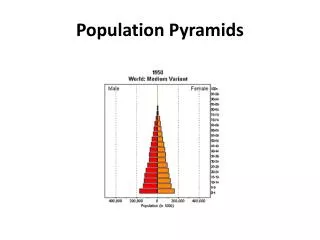
What is a population pyramid? • A diagrammatic representation of the age and sex composition of a population. • Allows you to analyze trends in birth & death rates, fertility rates, infant mortality rates, life expectancy as well as in similarities and differences in gender. • Helps to make predictions about future growth or decline. • Can give insight to the status of a particular country (core, periphery, semi-periphery). • Is really two bar graphs, one male and one female, back to back.
Analyzing population pyramids • By only the shape of the population pyramid, you can make predictions about a country’s future growth • There are five general shapes to look for: • Unstable • Expanding • Stable • Stationary • Declining
Unstable Population • High birth & death rates • Low life expectancy • Brings a countries medical system or political system into question • lack of contraceptives • lack of medical treatment • Consider: Infant Mortality Rate • War? Disease?
Expanding Population • High birth rates • Death rates a bit lower, life expectancy starting to improve • Suggests a decent medical system • Expect the country’s population to increase rapidly • Lots of young people, not many elderly people • Medical improving, nutrition improving, standard of life improving
Stable Population • Slow growth • Low birth & death rate • High life expectancy • Birth rate > Death rate • Suggests a good medical system: availability of contraceptives and medical treatment • Incomes increasing, standard of living increasing, children are becoming more of an expense
Stationary / Slow Growth Population • All age groups similar • Birth & death rates low • Life Expectancy high • Less and less babies • No growth • Birth rate = death rate
Declining Population • No country has reached this stage yet, therefore this pyramid represents a prediction of future trends • Low birth & death rate • High Life Expectancy • Death rate > Birth rate
Canada’s Population Pyramid *What can we decipher about Canada’s population from this pyramid? Which of the five classifications might we give to Canada? How did our population pyramid reach this shape? Germany
Analyzing Pyramids Afghanistan 2009 • classification? • death rate? • birth rate? • life expectancy? • predicted growth? • periphery, semi-periphery or core?
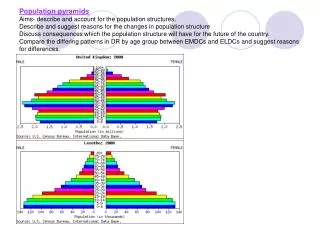
Analyzing Pyramids United Kingdom 2009 • classification? • birth rate? • death rate? • life expectancy? • infant mortality? • predicted growth? • periphery, semi-periphery or core?
Analyzing Pyramids Brazil 2009 • classification? • birth rate? • death rate? • life expectancy? • infant mortality? • predicted growth? • periphery, semi-periphery or core?