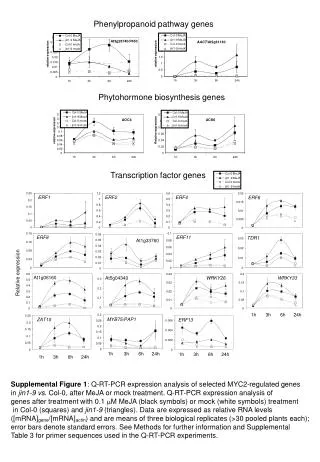
Inferring Transcription Factor Function via Regulon-Based Expression Analysis
This study investigates transcription factor (TF) activities through a novel regulon-based framework, analyzing genome-wide expression profiles using the T-profiler method. We explored two yeast regulon types, validating our approach through TF overexpression/deletion experiments. While mRNA levels can predict TF activity, they also poorly correlate with inferred TF activities. We identified significant co-modulation among pairs of TFs and presented a method to analyze condition-specific modulation of TF activity using unpaired t-tests, providing insights into environmental stress response mechanisms.

Inferring Transcription Factor Function via Regulon-Based Expression Analysis
E N D
Presentation Transcript
Inferring transcription factor function through regulon-based expression analysis Harmen Bussemaker Biological Sciences & C2B2 Columbia University
Hidden, protein-level TF activities TF1 TF2 TF3 Regulatory Connectivities Gene1 Gene2 Gene3 Measured mRNA abundances
“T-profiler”(Lascaris, 2003; Boorsma, 2005) Quantify the difference in mean expression between a gene set and its complement:
Score condition-specific differential activity of regulon using t-test
Two types of yeast regulons: • Based on ChIP-chip data (Harbison, 2004) • Based on consensus motif matches (SCPD)Large number (~1000) of conditions
Validation: • Overexpression/deletion of TF • Activator (Yap1p) and repressor (Rox1p)T-values consistent with expectation
How good a proxy is mRNA level for TF activity? mRNA level is a good predictor of TF activity mRNA level is a poor predictor of TF activity
Detecting “co-modulation” of pairs of TFs Inferred TF activities are highly correlated The mRNA levels arepoorly correlated
Conclusion Regulon-based analysis of genomewide expression profiles using the unpaired t-test is a simple but effective tool for analyzing the condition-specific modulation of TF activity http://www.t-profiler.org http://bussemakerlab.org/T-base/
ATACACAAAGACTCGTTACAAAAGCCG + ATACACAAAGACTCGTTACAAAAGCCG Genome PSAM Affinity Landscape Functional Predictor
mRNA expression acgacgcagcagca tctactacgagcgata aaaaccacggcttat cccctcttcatcactca ggactatactacaac
Nutrients Rapamycin Target of Rapamycin (TOR) Signaling Pathway Puf4p Puf3p Ribosomes Mitochondria Foat et al, PNAS, 2005
bZIP910 GAMYB E2F1 ZNF42_5-13 ZNF42_1-4 NF-Y Discovering Regulators of Human B-cell Maturation
Mina Fazlollahi Barrett Foat Pilar Gomez-Alcala Gabor Halasz Eunjee Lee Xiang-Jun Lu Ben Snyder Ron Tepper Luke Ward Sean Housmandi Wendy Olivas Kevin White Bas van Steensel Alexandre Morozov Andre Boorsma Frans Klis NIH, HFSP Acknowledgements