From Expression, Through Annotation, to Function
From Expression, Through Annotation, to Function. Ohad Manor & Tali Goren. Have you ever wondered… . Gene Expression (Microarray). Gene Expression (Microarray). Gene Expression (Microarray). Protein – Protein Interactions. Sub - Cellular Localization. GO Annotations. GO Annotations.

From Expression, Through Annotation, to Function
E N D
Presentation Transcript
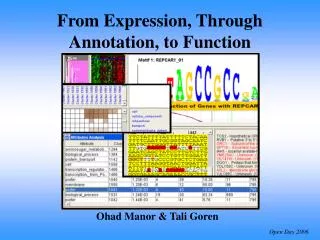
From Expression, Through Annotation, to Function Ohad Manor & Tali Goren
Gene Expression (Microarray) Gene Expression (Microarray) Gene Expression (Microarray) Protein – Protein Interactions Sub - Cellular Localization GO Annotations GO Annotations ChIP on chip ChIP on chip GO Annotations GO Annotations Types of Data What Characterizes these data sets? Systematic view in genomic large scale
0 1 Enr ch
0 1 Enr ch What is ? • A computational tool to check enrichment of data sets • Implemented in perl • Interactive command line • May be scripted… • Concatenate tests and matrix operations • Data manipulation functions and queries
Load biological data • Check enrichment of crossed data sets • Extract statistically significant results • Multiple hypothesis correction • Cluster gene sets • Save results 0 1 Enr ch Using
Non – Parametric: • no assumption about sample size or distribution • no parameters such as expectation or variance • Paired or Unpaired? What is statistically significant? • How to choose the right test to compare measurements?
Ribosome Assembly RAP1 Ribosome Assembly Gene1 Gene2 Gene3 Gene4 Gene5 Gene6 Gene7 Gene8 Gene9 Gene10 Gene1 Gene2 Gene3 Gene4 Gene5 Gene6 Gene7 Gene8 Gene9 Gene10 RAP1 Paired – Binary Version
heat shock YPD Gene1 Gene2 Gene3 Gene4 Gene5 Gene6 Gene7 Gene8 Gene9 Gene10 Gene1 Gene2 Gene3 Gene4 Gene5 Gene6 Gene7 Gene8 Gene9 Gene10 Gene1 Gene2 Gene3 Gene4 Gene5 Gene6 Gene7 Gene8 Gene9 Gene10 1 -1 Paired – continuous version
heat shock heat shock RAP1 Gene1 Gene2 Gene4 Gene5 Gene6 Gene1 Gene2 Gene3 Gene4 Gene5 Gene6 Gene7 Gene8 Gene9 Gene10 Gene1 Gene2 Gene3 Gene4 Gene5 Gene6 Gene7 Gene8 Gene9 Gene10 heat shock Gene3 Gene7 Gene8 Gene10 1 -1 Unpaired test
S. Cerevisiae Regulation • Let’s presume we know nothing about the Yeast • Use ENRICH to construct a basic regulatory network of Yeast • How can we do that?
STE12 RAP1 MSN2 FHL1 Gene1 Gene2 Gene3 Gene4 Gene5 Gene6 Gene7 Gene8 Gene9 Gene10 Ribosomal Stress Cell cycle Metabolism Ribosomal Stress Cell cycle Metabolism ChIP STE12 RAP1 YAP5 MSN2 SFP1 FHL1 GAT1 STE12 RAP1 YAP5 MSN2 SFP1 FHL1 GAT1 Significance threshold HG test Ribosomal Stress Cell cycle Metabolism Gene1 Gene2 Gene3 Gene4 Gene5 Gene6 Gene7 Gene8 Gene9 Gene10 P-values Binary values GO Flow chart
Metabolism Stress Cell cycle Yeast regulation network
FHL1 protein Case study
FHL1 – what is known • Putative transcriptional regulator • Predicted to be involved in stress response • Required for rRNA processing • Null mutant shows reduced growth rate • Could we have found all of that alone?
Exp. Gene1 Gene2 Gene3 Gene4 Gene5 Gene6 Gene7 Gene8 Gene9 Gene10 FHL1 Exp.1 Exp.2 Exp.3 Exp.4 Exp.5 Heat shock AA starvation osmotic stress oxidative stress invasive growth FHL1 genes Exp.1 Exp.2 Exp.3 Exp.4 Exp.5 Unpaired T-test HG test FHL1 FHL1 Conditions Gene1 Gene2 Gene3 Gene4 Gene5 Gene6 Gene7 Gene8 Gene9 Gene10 P-values P-values Exp.1 Exp.2 Exp.3 Exp.4 Exp.5 Binary values Experimental various conditions
FHL1 Gene1 Gene2 Gene3 Gene4 Gene5 Gene6 Gene7 Gene8 Gene9 Gene10 RAP1 FKH2 MBP1 GAT3 SOK2 HG test FHL1 ChIP Gene1 Gene2 Gene3 Gene4 Gene5 Gene6 Gene7 Gene8 Gene9 Gene10 P-values Tell me who are your friends…
Enriched conditions Enriched GO annotations Ribosome assembly Stress response Growth Enriched TF’s RAP1 SFP1 GAT3
Cell Periphery Mitochondrion Remember this question? • What is the connection between the expression level of a gene to its sub-cellular localization? • Which Transcription Factors regulate Amino Acid Biosynthesis? • Does a heat shock affect peripheral proteins more than it affects mitochondrial proteins?
Exp. Mitochondria Bud Neck Vacuole Cell periphery Nucleus Gene1 Gene2 Gene3 Gene4 Gene5 Gene6 Gene7 Gene8 Gene9 Gene10 Exp.1 Exp.2 Exp.3 Exp.4 Exp.5 Mitochondria Bud Neck Vacuole Cell periphery Nucleus Cell periphery Mitochondria genes Short HS Medium HS Long HS Severe HS Moderate HS Exp.1 Exp.2 Exp.3 Exp.4 Exp.5 Unpaired T-test HG test Short HS Medium HS Long HS Severe HS Moderate HS Localization Gene1 Gene2 Gene3 Gene4 Gene5 Gene6 Gene7 Gene8 Gene9 Gene10 P-values P-values Exp.1 Exp.2 Exp.3 Exp.4 Exp.5 Binary values Flow chart
0 1 Enr ch Future plans • Continue to develop • More data available out there • Build Regulation networks for the Yeast and other species
Thanks • Prof. Nir Friedman • Tommy Kaplan • And to you for listening!!!