Download
1 / 1
10 likes | 141 Views
Hobie Beach. Measurement of Multiple Microbial Indicators at Two Miami-Dade County Beaches. ASM General Meeting, May 2002 02-GM-A-1307-ASM: Q-51. Tomoyuki Shibata, M.S. & Helena Solo-Gabriele, Ph.D., P.E.

E N D
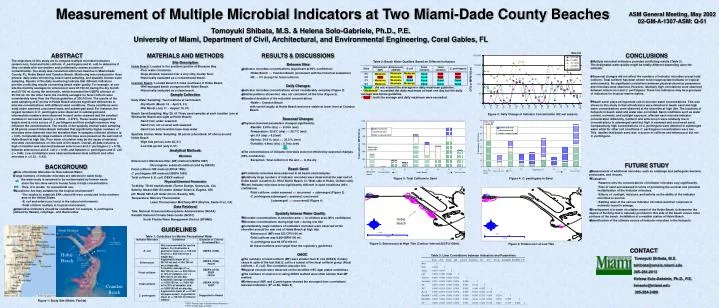
Hobie Beach Measurement of Multiple Microbial Indicators at Two Miami-Dade County Beaches ASM General Meeting, May 2002 02-GM-A-1307-ASM: Q-51 Tomoyuki Shibata, M.S. & Helena Solo-Gabriele, Ph.D., P.E. University of Miami, Department of Civil, Architectural, and Environmental Engineering, Coral Gables, FL ABSTRACT The objectives of this study are to compare multiple microbial indicators (enterococci, fecal and total coliform, C. perfringens and E. coli) to determine if they correlate with one another and preliminarily assess sources of contamination. The study was conducted within two beaches in Miami-Dade County, FL: Hobie Beach and Crandon Beach. Monitoring was conducted in three phases: daily water monitoring, beach sand sampling, and spatially intense water sampling. Results of the daily monitoring indicate that different indicators provide conflicting results concerning beach water quality. For example, at one site the monthly averages for enterococci were 81/100 ml during the dry month and 55/100 ml during the wet month, which exceeded the USEPA criterion of 35/100 ml. On the other hand, the monthly averages for fecal coliform were considerably lower than the Florida guideline of 200/100 ml. The results of the sand sampling at 27 points in Hobie Beach showed significant differences in microbe concentrations with different sand conditions. These conditions were sand under seaweed, uncovered sand, and submerged sand. For instance, the largest numbers of C. perfringens were observed in submerged sand, intermediate numbers were observed in sand under seaweed and the smallest numbers in uncovered sand (p = 0.0044 ~ 0.3721). These results suggest that beach sand is not a source of C. perfringens and that sunlight exposure may influence the concentrations. The results of the spatially intense water sampling at 58 points around Hobie Beach indicated that significantly higher numbers of microbes were observed near the shoreline than in samples collected offshore (p < 0.05). Comparatively large numbers of microbes were present at the east end of Hobie Beach at high tide. Poor water circulation may be the cause of elevated microbes concentrations on this side of the beach. Overall, all data inclusive, a high correlation was observed between enterococci and C. perfringens (r = 0.79), between enterococci and E. coli (r = 0.69), and between C. perfringens and E. coli (r = 0.63). Low correlations were observed between fecal coliform and other microbes (r = 0.32 ~ 0.43). • MATERIALS AND METHODS • Site Description • Hobie Beach: Located in the southern portion of Biscayne Bay. • Poor water circulation. • Dogs allowed, seaweed over a very silty, muddy floor. • Historically evaluated as a contaminated beach. Crandon Beach: Located about 2.5 miles southeast of Hobie Beach. • Well managed beach compared with Hobie Beach. • Historically evaluated as a clean beach. • Sample Collection Daily Water Sampling: Two locations at each beach • Dry Month (March 10 ~ April 9, 01) • Wet Month (July 11 ~ August 10, 01) Beach Sand Sampling: May 29, 01:Three sand samples at each location (one at Windsurfer Beach and eight at Hobie Beach) • Sand from under seaweed • Sand from not covered with seaweed • Sand from bottom within knee deep water Spatially Intense Water Sampling: 58 points (shoreline& off shore) around Hobie Beach • High tide period (June 25, 01) • Low tide period (July 2, 01) • Analytical Methods Microbes Enterococci: Membrane filter (MF) method (USEPA 1997) • Chromogenic substrate method (sold by IDEXX) Fecal coliform: MF method (APHA 1995) C. perfringens: MF method (USEPA 1995) Total coliform & E. coli: IDEXX method • Physical-Chemical Parameters Turbidity: TD-40 nephelometer (Turner Design, Sunnyvale, CA) Salinity: Model 4081 EC meter (Amber Science, Eugene, OR) pH: Model 525 A pH meter (Orion, Beverly, MA) Temperature: Mercury Thermometer • Laser Thermometer MiniTemp MT4 (ReyYek, Santa Cruz, CA) • Data Retrieval Tide: National Ocean and Atmospheric Administration (NOAA) Rainfall: National Climate Dada Center (NCDC) • South Florida Water Management District (SFWMD) • RESULTS & DISCUSSIONS • Between Sites • Indicator microbes concentrations (significant at 95% confidence) • Hobie Beach >> Crandon Beach (consistent with the historical evaluation) • H2 >> H1 (except for fecal coliform) • Daily Changes • Indicator microbes concentrations varied considerably everyday (Figure 2). • Similar patterns shown but also not consistent all the time (Figure 2). • Standard deviation of the microbial concentrations • Hobie > Crandon Beach • with varied largely at Hobie Beach and more stable at lower level at Crandon Beach. • Seasonal Changes • Physical-chemical parameters changed significantly. • Rainfall: 2.87in (dry) << 8.24in (wet) • Temperature: 25.6°C (dry) << 30.7°C (wet) • pH: 8.4 (dry) > 8.2(wet) • Salinity: 34.4 ‰ (dry) >> 30.0 ‰ (wet) • Turbidity: 4.9ntu (dry) < 5.7ntu (wet) • The concentrations of indicator microbes were not effected by seasonal changes • (95% confidence). • Exception: Total coliform in the wet >> in the dry • Beach Sand • All indicator microbes were observed in all beach sand samples. • Relatively large numbers of indicator microbes were observed at the east end of Hobie beach (Location A= Wind Surfer Beach, C= West side of Hobie, Q=East side). • Some indicator microbes were significantly different in sand conditions (95% confidence). • Total coliform: under seaweed >> uncovered > submerged (Figure 3) • C. perfringens:submerged > seaweed >uncovered • [submerged >> uncovered] (Figure 4) • Spatially Intense Water Quality • Microbes concentrations in shoreline area >> in offshore area (95% confidence) • Microbes concentrations during high tide > during low tide • Considerably, large numbers of indicators microbes were observed at the shoreline area at the east end of Hobie Beach at high tide. • Enterococci (MF) was 252 CFU/100 ml. • Total coliform was 8,664 MPN/100 ml. • C. perfringens was 94 CFU/100 ml. • All these numbers were larger than the regulatory guidelines. • QAQC • The numbers of fecal coliform (MF) were smaller than E. coli (IDEXX) in many cases in spite of the fact that E. coli is a subset of the fecal coliform group (Fecal coliform > E. coli). The correlation was also low. • Atypical colonies were observed on the modified mFC agar plates sometimes. • The numbers of enterococci using IDEXX method were often smaller than MF method. • Enterococci (MF) and C.perfringens showed the strongest liner correlations between indicators (R2 =0.66, Table 3). CONCLUSIONS Multiple microbial indicators provided conflicting results (Table 2). The designated water quality might be totally different depending upon the indicator. Seasonal changes did not affect the numbers of indicator microbes except total coliform. Total coliform has been shown to be inappropriate indicator in tropical environments. No significant correlations between physical-chemical parameters and microbes were observed. However, relatively high correlations were observed between enterococci and C. perfringens. These two indicators may be a good pair of indicators for tropical marine waters. Beach sand plays an important role in microbe water concentrations. This was shown in this study in that all indicators were detected in beach sand and high water concentrations were observed at the shoreline at high tide. The locations of hotspots in beach sand and water also coincided. Sand conditions such as water content, nutrients, and sunlight exposure, affected each microbe indicator concentration differently. Coliform and enterococci were relatively low in concentrations in submerged sand but high in seaweed and uncovered sand. Comparatively high concentrations of C. perfringens were detected in submerged water while for other soil conditions C. perfringens concentrations were low . This implies that beach sand was a source of coliform and enterococci but not C. perfringens. Table 2: Beach Water Qualities Based on Different Indicators Figure 2: Daily Change of Indicator Concentration (H2 wet season) • FUTURE STUDY • Measurement of additional microbes, such as coliphage and pathogenic bacteria, protozoans, and viruses. • Evaluation: • Reasons why the concentrations of indicator microbes vary significantly. • Role of sand and seaweed in terms of promoting the survival and potential multiplication of the indicator microbes. • Effects of sunlight, moisture, and salinity on the ability of the indicator microbes to survive. • Settling rates of the various indicator microbes and their response to nutrients found in sewage. • Development of a water circulation model of the Hobie Beach to determine the degree of flushing that is naturally provided to this side of the beach versus other portions of the beach. Installation of a weather station at Hobie Beach. • Identification of the ultimate source of indicator microbes to the hotspots. • BACKGROUND • Role of Indicator Microbes for Recreational Water: • If large numbers of indicator microbes are detected in water body, • the water body is assumed to be contaminated by human waste • since the microbes exist in human feces in high concentrations. • Thus, it is unsafe for recreational use. • Questions: Are they suitable for the tropical environment? • The studies to establish EPA criteria’86 were conducted in the northern area of the United States. • E. coli and enterococci exist in the natural environment. • Total coliform multiply in tropical environment. • Alternative indicators should be considered: for example, C. perfringens (utilized by Hawaii), coliphage , and Bacteroides. Figure 3: Total Coliform in Sand Figure 4: C. perfringens in Sand GUIDELINES Table 1: Guidelines for Marine Recreational Water Figure 5: Enterococci at High Tide (Contour Interval:25CFU/100ml) Figure 6: Enterococci at Low Tide CONTACT Tomoyuki Shibata, M.S. tshibata@umsis.miami.edu 305-284-2013 Helena Solo-Gabriele, Ph.D., P.E. hmsolo@miami.edu 305-284-3489 Table 3: Liner Correlations between Indicators and Parameters Figure 1: Study Site (Miami, Florida) FDEP: Florida Dept. of Environmental Protection FDOH: Florida Dept. of Health