Download
1 / 21
210 likes | 385 Views
C oastal I ntegrated T hroughput M odel. Debra R. Green Computer Specialist US Army ERDC Coastal & Hydraulics Laboratory. Debra R. Green Computer Specialist US Army ERDC Coastal & Hydraulics Laboratory. Features of CITM FORTRAN Code PC Based

E N D
CoastalIntegrated Throughput Model Debra R. Green Computer Specialist US Army ERDC Coastal & Hydraulics Laboratory Debra R. Green Computer Specialist US Army ERDC Coastal & Hydraulics Laboratory
Features of CITM • FORTRAN Code • PC Based • Cumulative/recent throughput output • Includes various environmental data • Models all current watercraft and off-load nodes • 1 minute time intervals ti = Base Time * Fexp * Ftod * Fss * Fcomp + Queue Time ttotal = ti + tmaint + tfuel
“Force Projection is a system of systems” • Very complex • Very nonlinear • must account for bottlenecks/problems • Extremely affected by environmental conditions • sea state varies day-to-day and year-to-year • tides and nearshore bars • must connect to inland throughput capabilities • Only an objective time-domain tool can provide accurate answers • CITM provides correct framework for this tool
PURPOSE Tool to evaluate force projection capabilities when deep-draft ports are unavailable • Conventional JLOTS • Lift-On/Lift-Off • Roll-On/Roll-Off • Emerging technologies • Theater Support Vessel (TSV) • Enhanced small ports • Identification of limiting factors to throughput • Objective site selection
CITM Version 2 • Includes effect of nearshore bars on bare beach discharge • Includes effect of tides • CITM Version 3 • Will include beach clearance/beach preparation module • Will include random effects • Will provide capability to integrate conventional JLOTS throughput and TSV throughput via existing unimproved and enhanced small ports
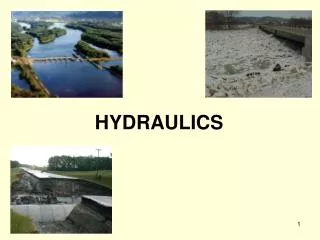
RECENT CITM IMPROVEMENTS NEARSHORE BATHYMETRY COMPONENT CROSS-BEACH COMPONENT
Effect of Tide and Bathymetry on Lighter Bare Beach Approach FRF Profile Data Elevation (m) Cross-shore Distance (m)
High Tide Mean Sea Level Low Tide Effect of Tide and Bathymetry on Lighter Bare Beach Approach Lighter, Draft = 3 ft FRF Profile Data Lighter, Draft = 3 ft Elevation (m) Cross-shore Distance (m)
Effect of Tide and Nearshore Bars on Throughput = Time Available for Bare Beach Access Min. Depth for successful CSP Bar Clearance Water Surface Elevation (m NGVD) Bar Crest Time (hrs)
Beach Clearance Module Sample of Plotted Output from Beach Clearance Module
Sample of Output from Beach Clearance Module *********************************************** ** CURRENT SIMULATION TIME: 155.0 Minutes ** *********************************************** Vehicle ID (Name): 9 (M1070/M1000/20FT) Assigned To Site: 3 Vehicle Speed: 0.00 Current Vehicle State: UNLOADING AT MARSHALING YARD Marshal01 IN Area-A X Y ------ ------ Current Location: 2.00 2.00 Location Heading Toward: 2.00 2.00 Site/Marshaling Yard Location Heading To: 2.00 2.00 Surface Type Vehicle Is On: ASPHALT 20-ft containers 40-ft containers RO/RO ---------------- ---------------- ----- Site Load: 294 199 10 Vehicle Load: 2 0 Marshaling Yard Load: 9 3 Marshaling Yard Vehicle Capacity: 1 Vehicle ID (Name) in MY Waiting Queue: Current Vehicle at Site Load Time: 0.0
CITM Support to War Planners • Real World: • Balkan theater of operations throughput analysis (classified) • War-fighter Exercises: • Ulchi Focus Lens (UFL) 2001 • Throughput analysis • JLOTS site evaluations • East coast Korea • RSO&I 2001 • Throughput analysis • JLOTS site evaluations • East and West coast Korea
Integration of CITM into Ongoing Efforts • US Army Engineer Research & Development Center (ERDC) Tele-Engineering Operations Center (TEOC) • integration of CITM into the Tele-Engineering Toolkit • addition of module for user-defined lighters • JLOTS Computer Based Training (Navy JLOTS training course) • inclusion of CITM as a training tool for students
TEOC Toolkit • Designed to facilitate communications between subject matter experts and persons submitting requests for information/analysis • Uses NIMA-produced data • Displays topographic maps, imagery, and terrain data for exploitation for engineer applications
LAVIII Wet JLOTS Site Selection
JLOTS Computer Based Training • Include stand-alone version of CITM • Objective is to create a tool for students to use to create a JLOTS resourcing and scheduling plan • Graphical User Interface (GUI) for input allowing the student to drag and drop and point and click (Currently under development) • Generic coastlines to include environmental characteristics of varying sea-states, tides, currents and beach gradients • OPDS Deployment and fuel delivery • Generate presentation-style output graphs
Example of GUI Screen • Icon Toolbar for ships, lighters and discharge sites • Drag and Drop capability for placement of icons • Distance from shore
Summary • CITM is a constructive simulation tool for objective estimates of throughput potential around the globe • Used in support of War-fighter Exercises • Throughput prediction for different nodes • Bare Beach • Existing Small Ports (unimproved) • Enhanced Small Ports