Download
1 / 22
220 likes | 355 Views
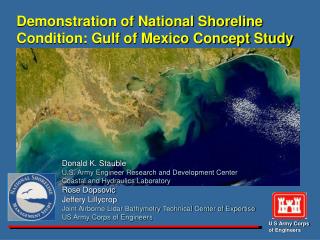
Demonstration of National Shoreline Condition: Gulf of Mexico Concept Study . Donald K. Stauble U.S. Army Engineer Research and Development Center Coastal and Hydraulics Laboratory Rose Dopsovic Jeffery Lillycrop Joint Airborne Lidar Bathymetry Technical Center of Expertise

E N D
Demonstration of National Shoreline Condition: Gulf of Mexico Concept Study Donald K. Stauble U.S. Army Engineer Research and Development Center Coastal and Hydraulics Laboratory Rose Dopsovic Jeffery Lillycrop Joint Airborne Lidar Bathymetry Technical Center of Expertise US Army Corps of Engineers U S Army Corps of Engineers
NATIONAL SHORELINE MANAGEMENT STUDY • Multi-Year Study – interagency effort to determine: • Extent and cause of shoreline erosion and accretion of • U.S. shoreline • Assess the economic and environmental impacts of • these shoreline changes • Examine Federal, State and Local Agency roles and • resources in shoreline management Goals: • Identify shoreline areas that have “Critical Erosion” • Recommend levels of Federal, State and Local participation • in shore protection • Use of systems approach to sand management Partners: NOAA, USGS, FEMA, MMS, NPS, FWS, Coastal States Org….
Develop National-Scale Inventory of shoreline change data Many Federal Agencies and Coastal States have compiled measurements of erosion and accretion and shoreline change patterns Shoreline change inventory on national scale will • provide support to NSMS Work Groups: • Shore Processes • Environmental Processes • Economic Processes • Agency Roles & Contributions • Systematic Sand Management
Shoreline Change Database Components Base Shoreline Map Historic Shorelines Shoreline Erosion Rates Critical Shoreline Erosion Areas
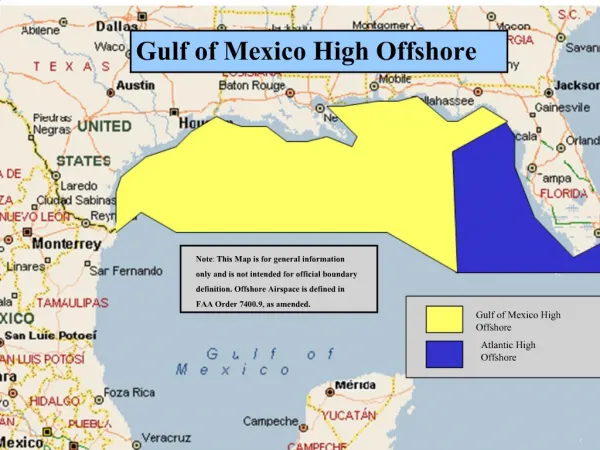
Pilot Study: Gulf of Mexico 1) High Resolution Shoreline Database and Base Map NOAA/CSC Digital Shoreline of US NOAA/NOS Shoreline Data Explorer & NOAA/CSC Shoreline CD’s MS AL TX LA +Historic Shorelines FL +Historic Shorelines +Historic Shorelines +Erosion Rates +Historic Shoreline +Critical Erosion Areas
NOAA/NOS and CSC High Resolution Shoreline Types - Attributes Man-Made Structures Marsh Shoreline of Record Pinellas Co, FL Boca Ciega Bay Gulf of Mexico Johns Pass Docks Jetties, Groins 1:10,000 or 1:20,000 scale common
Florida Coast Multiple Shoreline Segments 22 1 2 Barrier Islands Spits and Estuaries 4 3 21 Salt Marsh & Drowned Karst Deltaic Barrier & Spits 20 5 7 6 Barrier Is. , Estuary & Lagoons 19 Shoreline Type Morphologic Classification Headland 8 Barrier Is. & Estuaries 18 Barrier Is. & Lagoons 9 Data pieced together from 22 separate segments from NOAA/NOS Shoreline Data Explorer online, and /CSC sent on CD 17 10 12 Mangroves 13 11 14 Dates range from 1927 to 1980 Carbonate Keys & Reefs 16 15
Alabama/Mississippi Coast Alabama NOAA/CSC Digital Shoreline of US 1978-1982 Source Data 1:20,000 scale Mississippi NOAA/CSC Digital Shoreline of US 1986-1987 Source Data 1:20,000 scale Mobile Rias (Drowned Estuaries) Rias Gulfport Marsh Barrier Spits & Headland Barrier Islands & Sound Shoreline Type Morphologic Classification
Louisiana Coast NOAA/CSC Digital Shoreline of US 1932-1986 Source Data 1:10,000 to 1:20,000 scale New Orleans Atchafalaya R Chandeleur Is. Mississippi R. Chenier Plain Marsh Island Point Au Fer Island Plaquemines Barrier Sys. Timbalier Islands Acadian Bays Camarada-Moreau Headland/Grand Isle Isles Derniers Modern Delta Delta Plain Shoreline Type Morphologic Classification
Texas Coast Features Texas Coastal Zone Management Office Texas General Land Office -GIS Texas Bureau of Economic Geology Sabine Pass Deltaic/Marsh Freeport Harbor Ent. Galveston Bolivar Roads Brazos R. San Bernard R. Spit Colorado R. Texas Shoreline NOAA/CSC Digital Shorelines of US 1946-1989 Source Data 1:10,000 & 1:20,000 Scales Barrier Island San Louis Pass Matagorda Ship Channel Pass Cavallo Deltaic Barrier Islands/Spits Corpus Christi Aransas Pass Lagoons/Barrier Islands Shoreline Type Morphologic Classification Port Mansfield Channel Shoreline Brownsville Brazos Santiago Pass Channels
Supplementary data in selected areas on: • COBRA areas • FEMA flood zones • Beach Nourishment Projects • Road, railroad and water bodies • Shore Protection Structures • Political boundaries • Coastal morphology/geology • Shoreline types • Inlets/navigation project locations • Building footprints • Shorefront ownership/ type of use • Hurricane related shoreline impacts Hurricane Pass COBRA FEMA A zone FEMA AE zone FEMA X zone Dunedin Pass Beach Fill Project Limits FLDEP Profiles Clearwater Pass
Metadata Identification_Information: Citation: Citation_Information: Originator: United States Department of Commerce, National Oceanic and Atmospheric Administration (NOAA), National Ocean Service (NOS), National Geodetic Survey (NGS) Publication_Date: 20000808 Title: Vectorized Shoreline of Alabama Derived from NOAA-NOS Coastal Survey Maps Developed from 1983 - 1988 Source Data Edition: First Geospatial_Data_Presentation_Form: Map Publication_Information: Publication_Place: Charleston, SC Publisher: NOAA Coastal Services Center Other_Citation_Details: These data were created by the National Ocean Service, National Geodetic Survey (previously the National Ocean Survey) as part of its ongoing mission to map the coastline of the United States. The NOAA National Ocean Service, Coastal Services Center developed the procedures used in this project and was responsible for project oversight. The project intent was to rescue valuable historical data and make it accessible and useful to digital mapping products. This file is a further conversion of that product from a raster to a vector product that may be useful for Electronic Charting and Display Information Systems (ECDIS) and geographic information systems (GIS). Online_Linkage: http:/www.csc.noaa.gov/products/shorelines Description: Abstract: These data were automated to provide a suitable geographic information system (GIS) data layer depicting the historical shoreline for Alabama. These data are derived from shoreline maps that were produced by the NOAA National Ocean Service including its predecessor agencies……………… FGDC format Federal Geographic Data Committee
2) Historic Shoreline Change State of Florida Historic Shorelines FL DEP, Bureau of Beaches and Coastal Systems
Historic Shoreline Change _ Ship Island, MS 1917 1986 2001 Photo: Post Katrina 2005 AL MS LA Ship Is. Sources: USGS, NOAA, State of Mississippi
Historic Shoreline Change _ Chandeleur Islands, LA 1855 1950 2001 Photo: Post Katrina 2005 AL MS LA Sources: USGS, NOAA
m/yr Change -8 to -100 -8 t0 -6 -6 to -4 -4 to -2 -2 to -0.5 -0.5 to 0 0 to 0.5 0.5 to 2 2 to 4 4 to 6 6 to 8 8 to 100 USGS Shoreline Change Study 1976-2001 rate 1855-2001 rate 1999-2001 1976 1926-1953 1855-1895
3) State Defined Critical Shoreline Erosion Rates State of Texas Data Galveston Bay Bolivar Peninsula Source: Texas Bureau of Economic Geology Shoreline erosion rate (m) Galveston Is -31.6 - -16.1 -16.1 - - 8.0 - 8.0 - - 2.2 - 2.2 - +11.1 +11.1 - +37.0 Erosion San Louis Pass Accretion
4) Identify Areas of Concern (Erosion and Accretion) Boca Grande Pass Lee Co. FL Cape Coral Captiva Pass Pine Island Sound Red Fish Pass Shoreline Change Critical Erosion Blind Pass Ft. Myers Beach Non-Critical Erosion San Carlos Bay Critical Inlet Erosion Non-Critical Inlet Erosion Sanibel Is. Beach Nourishment Project FL DEP, Bureau of Beaches and Coastal Systems
Mapping Application • An online mapping application using ArcIMS has been created to distribute and display digital data collected for the efforts of the NSMS program. • Application is built upon existing industry standard technology and supports USACE Spatial Data Standards. ArcIMS provides the engine for distributing the online maps.
Dynamic mapping interface doesn’t require any special software.Only a web browser is needed to allow users have to build a map based on their preferences. Data layers can be toggled, and users can zoom, pan, measure, query, identify, label, and print the desire information.
The shoreline layers in the map service, allow the user to view specific details on selected line segments. Here the user can see the type, scale, and date of the shoreline line segment.
Summary • The online mapping application allows all users, regardless of skill level, to access digital data in a user friendly format. • General user can use interface to browse the datasets and advanced users can download the data directly from the web site and migrate or link to an existing enterprise GIS. • http://gis.sam.usace.army.mil/ maproom/_C025/Default.asp