Download
1 / 21
220 likes | 374 Views
Established in 1977, the U.S. Army Corps of Engineers Field Research Facility in Duck, NC, leads pioneering storm surge modeling research for FEMA Region III. This project aims to assess inundation risks from both tropical and extratropical storms through advanced modeling techniques, high-resolution bathymetry, and extensive validation. Key project phases include storm forcing analysis, comprehensive flood risk assessments for 10- to 500-year return periods, and collaboration with universities and research entities. Results inform hazard preparedness and response strategies across the region.

E N D
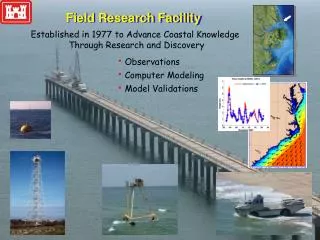
Observations • Computer Modeling • Model Validations Field Research Facility Established in 1977 to Advance Coastal Knowledge Through Research and Discovery
FEMA REGION III COASTAL STORM SURGE PROJECT OVERVIEW Jeff Hanson U.S. Army Corps of Engineers Field Research Facility, Duck, NC November 1, 2011 FEMA-USACE Coastal Hazard Workshop US Army Engineer Research and Development Center (ERDC)
Project Objectives • Storm Forcing • Extratropical Wind Fields • Hurricane Tracks Development Phase (2008-2011) Develop and validate a storm surge modeling capability for the assessment of inundation risk in Region III High-Res Bathy / Topo Mesh • Consistent 10-m DEM for the region • Extratropical and tropical storm hazard • Integrated flood risk modeling system • Comprehensive system validation Storm Surge Modeling Winds Waves Water Levels • Return Period Analysis • Hurricanes • Extratropical Storms Production Phase (2011) Flood Levels 10-, 50-, 100-, & 500-year • Extratropical and tropical storm production runs • Extratropical return period analysis (EST) • Tropical return period analysis (JPM) • Synthesis of results Assess the Region III flood hazard values for 10-, 50-, 100- and 500-yr return periods
Project Partners USACE – Project Oversight, DEM, Model Validations, Extratropical Analysis, Mapping review Renaissance Computing Institute – DEM, Modeling System, Production, GIS Viewer, Analysis University of North Carolina – Water level modeling guidance Applied Research Associates – Synthetic Hurricanes, JPM Return Period Analysis ARCADIS – DEM, Modeling Mesh Oceanweather – Extratropical and Hurricane Wind Fields Elizabeth City State University – GIS Displays RAMPP – Project Review, Mapping Phase Lead
Project Partners North Carolina Floodplain Mapping Project Partners: Leveraging of Capability and Modeling Infrastructure for Region III Study
Project Organization FEMA Program Manager Robin Danforth FEMA / DHS Region III Advisory Board R. Luettich (UNC-CH) B. Ebersole (USACE-CHL) J. Smith (USACE-CHL) K. White (USACE-CRREL) K. Galluppi (RENCI) M. Powell (DE) NAP, NAB, NAO USACE Storm Surge Project Manager J. Hanson (USACE-FRF) M. Forte (USACE-FRF) J. Roughton (USACE-FRF) RAMPP J. Gangai (Dewberry) B. Batten (Dewberry) Bathy / Topo M. Forte (USACE-FRF) L. Stillwell (RENCI) J. Miller (NAP) M. Hudgins (NAO) P. Moye (NAO) M. Schuster (NAB) J. Scott (NAB) H. Roberts (ARCADIS) J. Atkinson (ARCADIS) Storm Specification P. Vickery (ARA) V. Cardone (Oceanweather) A. Cox (Oceanweather) Modeling System B. Blanton (RENCI) P. Vickery (ARA) V. Cardone (Oceanweather) A. Cox (Oceanweather) GIS Database K. Gamiel (RENCI) B. Blanton (RENCI) L. Stillwell (RENCI) M. Forte (USACE-FRF) J. Yuan (ECSU) Validation H. Wadman (USACE-FRF) J. Hanson (USACE-FRF) B. Blanton (RENCI)
FEMA Region III Study Area • Four states • Five metropolitan areas Region III Population Density
FEMA Region III Study Area • Four states plus District of Columbia • Five metropolitan areas • Complex coastal geomorphology • Delaware River/Bay system - Tidal up to Trenton, NJ - 782 square mile bay - Strategic shipping and military port • Chesapeake bay - Third largest estuary in world - 11,000 miles of tidal shoreline - Major shipping, seafood and military ports
High Resolution Bathymetry and Topography Digital Elevation Model (DEM) • Data assimilation through USACE districts • Use Lidar for topography where available • Region initially divided into 20 tiles • Consistent bathy/topo surface with 10-m horizontal resolution 10-m Resolution Region III DEM Geographic Tiles
High Resolution Bathymetry and Topography Unstructured Modeling Mesh • Mesh triangulation through alignment with DEM features ADCIRC Modeling Mesh Project Site
High Resolution Bathymetry and Topography Unstructured Modeling Mesh • Mesh triangulation through alignment with DEM features • Interpolation of DEM elevations to mesh • Manual insertion of control points Elevations (m)
Water Levels SWAN Coupling ADCIRC Coastal Circulation and Storm Surge Model Storm Surge Modeling System Wind and Pressure Fields HBL Hurricane Model OWI Extratropical Reconstructions Waves/ Radiation Stress unSWANBasin and Coastal Waves Radiation Stress
Region III Modeling System Validation Isabel Isabel
Storm Forcing Identify and reconstruct historical extratropical storms in Region III • Selection based on water levels at 10 stations • Top ranked 30 historical storms 1975-2008 • Nor’Ida (Nov ‘09) added as 31st Storm • Kinematic reanalysis of all wind fields • Careful validation against historical records Reconstructed pressure fieldsFebruary 1998 Event – A top-ranked storm
Central Pressure Difference Heading Storm Forcing Develop a representative set of synthetic hurricanes • Record of 20 hurricanes in 60 years insufficient for 100- and 500-yr computations • ARA 100,000-yr synthetic storm set used to extract 156 representative storm tracks • Demonstrated validity with comparisons to historic data Modeled Tracks VA/DE/NJ
Storm Forcing Develop a representative set of synthetic hurricanes JPM vs. 100,000 yr Dataset • Record of 20 hurricanes in 60 years insufficient for 100- and 500-yr computations • ARA 100,000-yr synthetic storm set used to extract 156 representative storm tracks • Demonstrated validity with comparisons to historic data • Joint Probability Method (JPM) hurricane track parameters assigned • Windfield reconstruction with HBL Tropical cyclone windfield model HBL Windfield
Production Runs Computations • 28 Extratropical Storms • 156 Hurricanes Region III Solution Browser • GIS interface to results • Google-earth displays of storm tracks, model output fields and return periods Storm Selection Inundation Levels
Statistical Analysis Lewes, DE Combined 100-yr Water Levels (m) Extratropical Water Levels Surge Levels Return Period Combined Analysis • Extratropical water levels • Hurricane water levels • Tidal contributions • 10, 50, 100, and 500-yr levels
Project Review Peer-reviewed by National Experts Project Team Results Advisory Group Oversight RAMPP Review ERDC Review Project Reports
Project Reports 1.2 Modeling System 1.1 DEM 1.3 Storm Forcing Coastal Storm Surge Analysis: Final Report 2. Model Validation 3. Final Analysis • Document methods and results • Multi-tiered reviews • Released as formal reports