Download
1 / 8
80 likes | 285 Views
Production Possibility Curves. -Productive resources also meet the problem of scarcity -W e can not produce all we want of everything -There is always opportunity cost when employing our resources Example- -If a society has only 2 wants- beds and buns

E N D
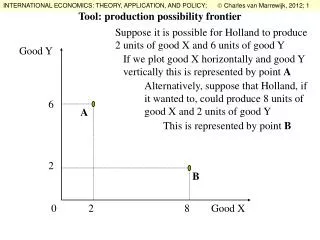
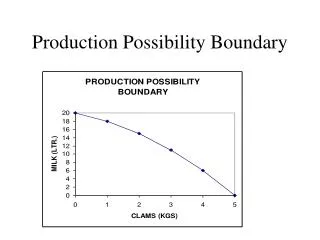
-Productive resources also meet the problem of scarcity -We can not produce all we want of everything -There is always opportunity cost when employing our resources Example- -If a society has only 2 wants- beds and buns -the Society has only so many productive resources to make either beds or buns -if we want 10 beds, we have to use all our productive resources -if we want 1 bun, we need to give up some beds made by the productive resources to create it - We could then end up with 1 bun and 8 beds - 2 beds are the opportunity cost of putting the needed productive resources to work on making that 1 bun
Production Possibility Curve example # 1 Choice Tractors Butter Opp. Cost.
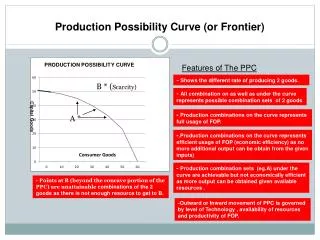
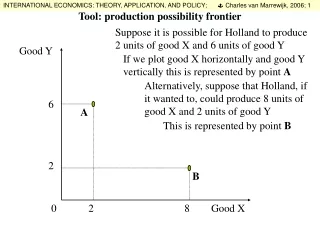
Basic Facts about Production Possibility Curves 1. Point A ( first point) and last point will always have a zero. This means the first and last point will be on an axis. 2. Whichever item ( tractors or butter for example) that has a zero (0) for point A; that item always goes on the X axis. 3. You can't have an opportunity cost until a decision or choice has been made.
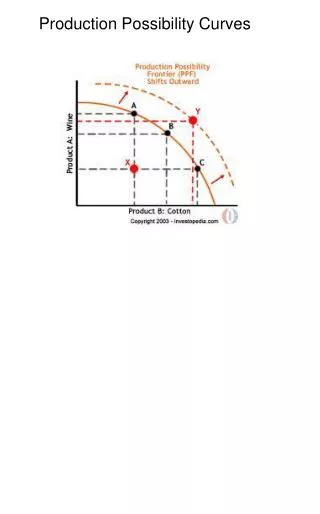
Basic Facts about Prod. Poss. Curves / Graphs 1. Point X is always inside the curve. ( Unused resources) 2. Point Y is always outside the curve ( unattainable) 3. The X and Y axis represents the two items being produced by a society / business. 4. A point that is located on the Curve shows 100 % efficient use of all resources. 5. The closer to the zero / 0 ( point of origin) the more inefficient the society is. 6. The closer to the production curve / line the more efficient the society is. 7. Everything inside the curve is achievable, everything outside the curve is unachievable.
A real economy is infinitely more complex then this example, but it faces the same problem...... which is? scarcity of productive resources