Download
1 / 10
120 likes | 434 Views
Production Possibilities Curves. Production Possibilities. Production Possibilities Curve- (graph) shows alternative ways to use an economy’s productive resources. The axes of the graph can show categories of goods and services. (farm goods and factory goods)

E N D
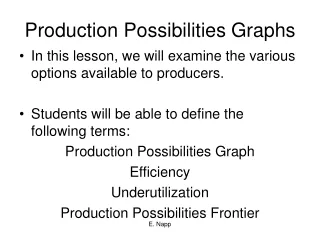
Production Possibilities • Production Possibilities Curve- (graph) shows alternative ways to use an economy’s productive resources. • The axes of the graph can show categories of goods and services. (farm goods and factory goods) • The axes can also show any pair of specific goods or services. (hamburgers and hotdogs).
All Shoes, No Watermelons Shoes (in millions of pairs) Watermelons (in millions of tons)
Shoes (in millions of pairs) All Watermelons, No Shoes Watermelons (in millions of tons)
Production of Watermelons and Shoes B. (8,14) Shoes (in millions of pairs) C. (14,12) D. (18,9) E. (20,5) F. (21,0) Watermelons (in millions of tons)
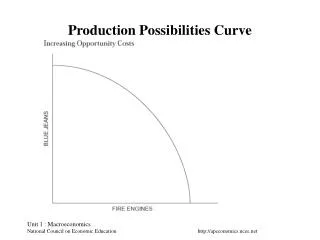
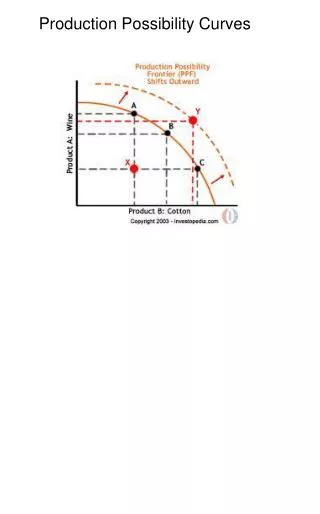
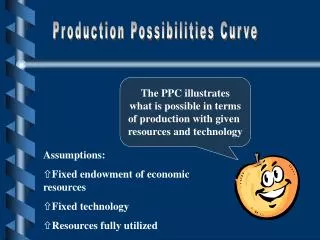
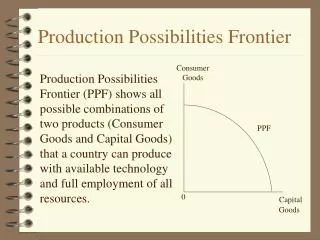
Production Possibilities Curve • Production Possibilities Frontier- The line we draw that shows combinations of the production of our goods or services. • ANY POINT ON THAT LINE REPRESENTS A POINT AT WHICH THE COMPANY IS USING ALL OF ITS RESOURCES TO PRODUCE A MAXIMUM COMBINATION OF THOSE TWO PRODUCTS. • Represents an economy working at its most efficient level of production. • Efficiency- using resources in such a way as to maximize the production of goods and services. • Moving along the line represents a trade off between the two goods or services.
Underutilization Underutilization- using fewer resources than the economy is capable of using. Future Production Possibilities Frontier Shoes (in millions of pairs) Underutilization Watermelons (in millions of tons)
Production Possibilities Frontier • New Technology, more immigrants, more labor, economy growing, or the supply of labor or capital increases—shifts the frontier to the right. • Population ages, lose land in war, people become unhealthy or uneducated, or a decrease in capital or labor would shift the curve left.
Production Possibilities • Cost: The alternative we give up when we choose one option over the other. (OPPORTUNITY COST) • Law of Increasing Costs: As the production switches from one item to another (shoes to watermelons), more and more resources are necessary to increase production of the second item (watermelons). • Therefore… the opportunity cost increases! • WHY?! • Countries must look at their resources and technology to decide what to produce.