Download
1 / 18
220 likes | 575 Views
Module 3 The Production Possibility Curve. What you will learn in this Module:. Trade-offs are important in economic analysis The production possibilities curve model reveals about the economy (efficiency, opportunity cost, and economic growth)

E N D
What you will learn in this Module: • Trade-offs are important in economic analysis • The production possibilities curve model reveals about the economy (efficiency, opportunity cost, and economic growth) • 2 sources increase economic growth: increased availability of resources and improvements in technology
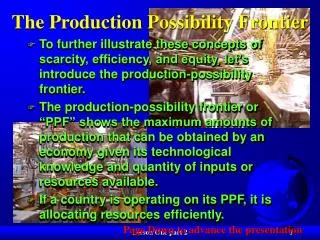
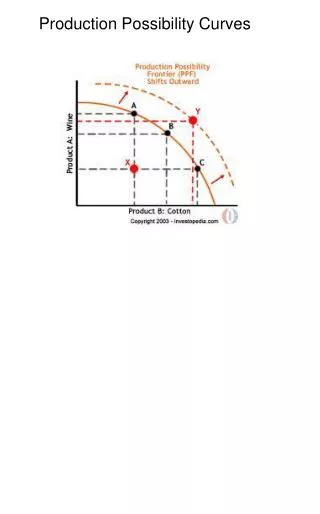
Trade Offs & the Production Possibility Curve • Trade off: • what you give up in order to have something else…why? You cannot have everything! • Production possibility curve: • Illustration that shows the trade offs in an economy for 2 products. It shows the max quantity of a good that can be produced for each possible quantity of the other. • Why is this important? • The PPC model improves understanding of trades offs in a simplified manner
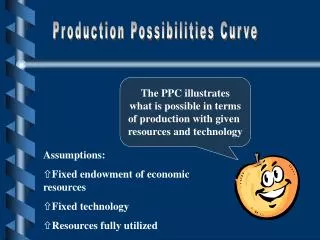
The Production Possibilities Curve Assumptions: Available supply of resources is fixed in quantity and quality at this point in time. Technology is constant during analysis. Economy produces only two types of products.
What Information is Received from a PPC? • PPC shows ________________ _________that an economy can use its resources. • PPC _________________________is the line that shows the maximum possible output for that economy. • ____________________ means no missed opportunities! Points along the curve illustrate efficiency. • PPC shows ___________, or what is given up; the trade off of producing more or less of the other product (look at the coordinate points). The more calzones that are produced, the less pizzas.
What Information is Received from a PPC? • PPC shows alternative ways that an economy can use its resources. • PPC frontier line is the line that shows the maximum possible output for that economy. • EFFICIENCY means no missed opportunities! Points along the curve illustrate efficiency. • PPC shows COST, or what is given up; the trade off of producing more or less of the other product (look at the coordinate points). The more calzones that are produced, the less pizzas.
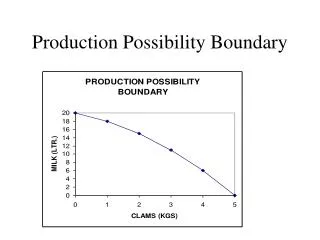
Production Possibilities & Castaway….http://www.youtube.com/watch?v=c2g2U_-9H9o&safety_mode=true&persist_safety_mode=1&safe=active • Castaway ~ Tom Hanks had to survive after a plane crash with only the resources salvaged from the plane wreckage and the ones found on the island. • With these limited resources, he must make a trade off between fish production and coconut production. • p. 17 Figure 3.1 • What is the maximum quantity of fish Tom can catch if he gathers 9, 15, 20 coconuts? • When Tom is producing 30 coconuts, how many fish is he producing? • WHY? Is this efficient?
What Information is Received from a PPC? • PPC shows: • underutilization: (inefficiency) NOT maximizing resources found underneath the frontier line • PPC shows: • Growth:If more resources become available, or if technology improves, an economy can increase its level of output and grow. When this happens, the entire production possibilities curve “shifts to the right.” Where on the PPC, what point, is Tom being efficient with his resources? Where is he MOST efficient? Where on the graph (what point) is Tom being inefficient with his resources? Give an example of inefficiency in the economy. Where on the graph (what point) would you expect to see future growth?
The PPC Slopes. Why? Opportunity Cost - Increasing Opportunity Cost - Constant
Why is a Production Possibility Curve Curved?Krugman’s Figure 3.2 p. 19 • When Tom is producing 30 coconuts how many fish does he produce? • 0 Fish • When he decides to produce fish, reallocating his resources from coconut production to fish production, he produces 20 fish, but what is the trade off? In other words what does he give up? • 5 coconuts • Is this a rational decision? In other words does the benefit exceed the cost? Why or why not?
EF2b: The Decision Making Process • D = define the problem (root cause or issue) • L = list the alternatives (other choices) • S = state the criteria (priorities & how to judge the situation) • E = evaluate the alternatives (what are the trade offs & opportunity costs of each alternatives? What can you live with?) • M = make a rational decision (what is the marginal benefit? What is the marginal cost?) • What should outweigh what?
Law of Increasing Opportunity Costs • The amount of products given up to obtain more if any given product is called __________________ __________. • The more of a product produced the ______________ the opportunity cost. • WHY?? • The slope of a production possibilities curve becomes _____________ (going left to right) demonstrating increasing _____________________ ________.The curve appears bowed out or concave.
Law of Increasing Opportunity Costs • The amount of products given up to obtain more if any given product is called opportunity cost. • The more of a product produced the greateris its opportunity cost. • WHY?? Resources are scarce. More resources must be diverted and allocated away from the original product. (think guns or butter) • The slope of a production possibilities curve becomes steeper (going left to right) demonstrating increasing opportunity cost.The curve appears bowed out or concave.
Law of Increasing Opportunity Costs • WHY DOES THIS LAW EXIST? • All economic resources are not equal or can be used for the same task. • Economic resources are not perfectly adaptable to alternative uses. • Instead of pizza, let’s make bulldozers. (Pizza resources vs. Bulldozer resources) What problems do you foresee? Can we make bulldozers with dough, ovens & cheese? (resources) Can we make pizza with steel and wires? (resources) Are workers trained to make pizza may well trained to build heavy equipment? (labor) Is a pizza oven (capital) well suited to build a bulldozer?
Economic Growth – it’s the rage buzzword What is economic growth exactly? • A sustained rise in aggregate output…ok…more… • Expansion of the economy’s production possibilities • Krugman’s p. 20 figure 3.3 • What does point A represent on the curve? • 2. What does point E represent on the curve?
Economic Growth – it’s the rage buzzword What is economic growth exactly? • A sustained rise in aggregate output…ok…more… • Expansion of the economy’s production possibilities • Krugman’s p. 20 figure 3.3 • What does point A represent on the curve? • 20 fish, 25 coconuts, efficient production of both products (maximizing production with resources given), frontier line • 2. What does point E represent on the curve? • Increase in production 25 fish, 30 coconuts, economic growth…but how does it grow?
What Makes Production Grow??? • What could help Tom catch more fish? • A net maybe, fishing pole, more bait… • So an increase in resources…Land, Labor, Capital, Entrepreneurship will grow an economy • Also an increase in technology (technical means for production of goods and services) will grow the economy…an innovation or new process if you will
Activity: Graphing a PPCPizza & Bulldozers Can an economy produce both of these?