Cont’d
Using gravity model to study the degree of integration: Location choice question – which specific country is relatively more integrated into the multi-diamond model?. Cont’d. Cont’d.

Cont’d
E N D
Presentation Transcript
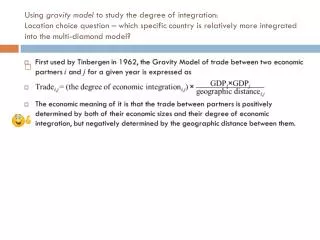
Using gravity model to study the degree of integration:Location choice question – which specific country is relatively more integrated into the multi-diamond model?
Cont’d • Geographic distance should be an index of all distances between two partners’ major cities weighted by each city’s population density. • Data sources: • [1] Country-pair trade data: ITC at http://www.intracen.org/ (pick a country, then go to its profile of “trade and investment data”, under which there is a database on “trade in good statistics” / “trade in services statistics”) • [2] GDP data: World Bank at http://data.worldbank.org/indicator/NY.GDP.MKTP.CD • [3] Weighted geographic distance data: CEPII at http://www.cepii.fr/anglaisgraph/bdd/distances.htm • Download the results here: • [1] EU integration is generally decreasing, although some countries show temporary increase in integration right after their accession into EU • [2] Smaller (later) EU members are relatively more integrated (through trade), partially because they are more open to trade • [3] Most countries show significant increases in the degree of integration during the recovery period after 07-09 global financial crisis • Strategic implications: not what you thought…some smaller countries might be a good location choice for trade-intensive companies.
Course structure Classes 1-4 Classes 5-9 Class 10 Classes 11-14 International business environment Regional vs. global Triad and IB activities Politics, culture, trade and finance Firm-specific advantages and firm management Organization Production Marketing International HRM Political risk management International financial management Country-specific advantages Locational choice and regional management European Union, North America, Japan, and Emerging Markets
The most dynamic area in NAFTA is the Great Lakes (e.g., NY, ON) Most Canadians live along the border Most Mexicans live around the Mexico City
Introduction • The North American Free Trade Agreement (NAFTA) is an agreement signed by Canada, Mexico, and the US, creating a trilateral trade bloc in North America. It came into force on January 1, 1994. • It superseded the US-Canada FTA, which was signed on January 2, 1988.
Introduction • NAFTA has not abolished all trading barriers between the United States, Canada and Mexico, and therefore is not a pure free trade agreement [p. 555] – different from EU • Each NAFTA partner retains its own trade laws – different from EU • A legal mechanism to appeal trade decisions exists. • Although NAFTA is a step toward trade liberalization, business decisions should not assume that “free trade” makes Canada and Mexico identical to the United States. • e.g., the paradox of cultural similarity between US and Canada
Current profile • According to ITC database: • NAFTA is by far the largest trading bloc under an effective FTA • US’s trade of goods with Canada and Mexico has reached more than $1.1 trillion in 2012, compared to only $655 billion in EU28 in the same year. • Potential bigger ones: Trans-Pacific Partnership; Trans-Atlantic Partnership (US-EU).
Current profile (cont’d) • According to ITC database: • US’s exports of goods to Canada and Mexico have reached more than $508 billion in 2012, representing about 33% of US’s global exports (19% from Canada; 14% from Mexico). • The total export value has more than tripled since 1994, when NAFTA was signed (US dept of comm.) • US’s exports to all EU28 nations in 2012 were only $266 billion. • Major exported products to Canada are: Vehicles; Machinery, nuclear reactors, boilers; Electronics; Mineral fuels, oils, distillation products; and Plastics. • Major exported products to Mexico are: Machinery, nuclear reactors, boilers; Electronics; Mineral fuels, oils, distillation products; Vehicles; and Plastics.
Current profile (cont’d) • According to ITC database: • US’s imports of goods from Canada and Mexico have reached more than $607 billion in 2012, representing about 26% of US’s global imports (14% with Canada; 12% with Mexico). • The total import value has more than tripled since 1994, when NAFTA was signed (US dept of comm.) • US’s imports from all EU28 nations in 2012 were only $389 billion • Major imported products from Canada are: Mineral fuels, oils, distillation products; Vehicles; Machinery, nuclear reactors, boilers; Plastics; and Electronics. • Major imported products from Mexico are: Electronics; Vehicles; Machinery, nuclear reactors; boilers; Mineral fuels, oils, distillation products; and Optical, photo, technical, medical, etc apparatus.
Current profile (cont’d) • According to ITC database: • Canada’s exports of goods to the US and Mexico represented 76% of its global exports (75% to US; 1% to Mexico). • Canada’s imports of goods from the US and Mexico represented 57% of its global imports (51% from US; 6% from Mexico).
Current profile (cont’d) • According to ITC database: • Mexico’s exports of goods to the US and Canada represented 81% of its global exports (78% to US; 3% to Canada). • Mexico’s imports of goods from the US and Mexico represented 53% of its global imports (50% from US; 3% from Canada).
NAFTA members and EU • In 1997, Mexico and EU concluded an Economic Partnership, Political Coordination and Cooperation Agreement (the Global Agreement), which included trade provisions that were developed in a comprehensive FTA that entered into force in October 2000 for te part related to trade in goods, and in 2001 for that related to trade in services. • On 18 October 2013, Canada and EU reached a political agreement on the key elements of a trade agreement (CETA), which will remove over 99% of tariffs. It is now awaiting for the approval by the EU Council and the European Parliament. • In July 2013, the EU and the US held their first of negotiation for the biggest trade deal in the world – Transatlantic Trade and Investment Partnership (TTIP) – in Washington D.C. The second round will be held in Brussels, Belgium, on 11-15 November 2013.
Canada Picture: Canadian PM Stephen Harper, left, spoke to American President Barack Obama, right, at the 2011 APEC Summit in Kapolei, Hawaii, Nov 13, 2011.
Largest trading partners at metro-city level:Houston, TX, and Calgary, AB, in oil and petroleum
Canada’s economy • Canada’s 34 million people enjoy one of the highest standards of living in the world. • 80 percent of manufacturing activity is located in Ontario and Quebec, including the entire motor vehicle industry • One-quarter of all Canada’s manufactured exports (and imports) are in autos and auto-related products. Based on the availability of goods and services, low personal risk, and an effective infrastructure, but not climate and the cost of living.
Canada’s business environment • Canada’s industrial climate: • Characterized by private enterprise. • Some industries, such as broadcasting and public utilities, are government owned (i.e., Crown companies) or subject to substantial government regulation. • A trend toward privatization and deregulation. • Small business is a major part of the economy and accounts for almost 80% of all new employment in manufacturing. • The service and retail trade industries are characterized by a large number of companies that vary in size. • 70% of Canadians work in service industries.
Canada’s business environment (Cont’d) • Canada’s regulatory environment: • Commerce and industry in Canada is regulated at every level of government: federal, provincial and municipal. • The regulation of anticompetitive practices is handled by the Federal government under the Competition Act. • Export permits are required for the shipment of goods having strategic value, and to implement the provisions of various international agreements. • Import documentation is also required, as well as payment of a goods and sales tax (GST). • The Canadian federal government has a bilingual policy. But, in the province of Quebec, French is the official language for business and education.
Canada’s business environment (Cont’d) • Banking and finance: • 6 major banks account for 90% of the industry’s assets. • The central bank: Bank of Canada. • Labor relations: • The Canada Labor Code is the federal law that covers such matters as wages, employment practices, work safety, and conciliation in the event of a labour dispute. • Province governments have similar laws to cover employer–employee relations at the local level. • 30% of the total labour force is unionized. • Legislated minimum wage rates. • All provinces prohibit employment discrimination on the basis of race, religion, national origin, color, sex, age or marital status.
Canada’s business environment (Cont’d) • Investments: • The Investment Canada Act (ICA) came into effect on June 30, 1985, and is designed to create a welcome climate for foreign investment by significantly loosening previous restrictions. • At the same time, however, there are some regulations that remain in effect.
Business opportunities in Canada • FTA and NAFTA have increased the level of integration between Canada and the US. Some provisions of these agreements are: • All tariffs on US and Canadian goods were eliminated by 1998. • Most import and export quotas were eliminated by 1998. • Use of product standards as a trade barrier is prohibited and national treatment of testing labs and certification bodies is established. • Many restrictions on agricultural products, wine and distilled spirits, auto parts and energy goods have been sharply reduced, if not totally eliminated. • The size of the government procurement markets that will be open to suppliers from the other country is slightly increased.
Business opportunities in Canada (Cont’d) • Travel by business visitors, investors, traders, professionals and executives transferred intracompany is facilitated. • The opportunity to make investments in each other’s country is facilitated and encouraged through the adoption of national treatment. • A binational commission to resolve disagreements that may arise from the enforcement of the FTA has been established and dealt with some 20 cases in the first three years of the Agreement.
Mexico’s economy • Mexico has one of the strongest economies in Latin America. • Labour • relatively plentiful and inexpensive; • shortage of skilled labour and managerial personnel; • turnover is a serious problem; • 40% of the labor force is unionized. In large operations, 80% of the labour force is unionized; • three-tier minimum wage (rural, metropolitan, and isolated regions); • at least 90% of the firm’s skilled and unskilled workers must be Mexican nationals.
Mexico and trade agreements • North American Free Trade Agreement (NAFTA) • Latin American Integration Association (LAIA): a free trade group formed to reduce intra-regional trade barriers and to promote regional economic cooperation. Argentina, Bolivia, Brazil, Chile, Colombia, Ecuador, Mexico, Paraguay, Peru, Uruguay and Venezuela are all members. • Free Trade Area of the Americas (FTAA): a proposed regional trade agreement that is expected to succeed NAFTA and include 34 countries across North, Central and South America.
Mexico in the diamond model • Mexico is developing its national competitive advantage by relying heavily on a series of strategic clusters. • The six major ones, in order of importance are: • petroleum/chemicals; • automotive; • housing and household; • materials and metals; • food and beverage; • semiconductors and computers.
In 1992, before the treaty was ratified, independent U.S. Presidential candidate Ross Perot famously warned voters to prepare for the "giant sucking sound" of jobs moving across the border to Mexico, where NAFTA would enable companies to take advantage of cheap labor. • Mexico's average hourly manufacturing wage is still only about 13 percent of that of the U.S., but even with that persistent disparity, most jobs these days aren't being shipped to America's southern neighbor.