Download
1 / 20
200 likes | 316 Views
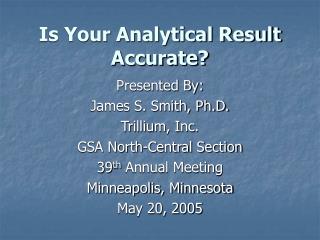
Is Your Analytical Result Accurate?. Presented By: James S. Smith, Ph.D. Trillium, Inc. GSA North-Central Section 39 th Annual Meeting Minneapolis, Minnesota May 20, 2005. Analytical Chemistry. Qualitative – Identity of the analyte Quantitative – How much is in the sample.

E N D
Is Your Analytical Result Accurate? Presented By: James S. Smith, Ph.D. Trillium, Inc. GSA North-Central Section 39th Annual Meeting Minneapolis, Minnesota May 20, 2005
Analytical Chemistry • Qualitative – Identity of the analyte • Quantitative – How much is in the sample
Problem Beginning Mr./Ms. Name Plant Manager Company Address Re: Notice of Violation and Assessment of Civil Penalties Dear Mr./Ms. Name:
Violation Plant Effluent into the POTW Sewer Maximum amount of mercury (Hg) in the effluent for the plant’s use permit is 150 ng/L (parts per trillion)
Results Month Hg Concentration (ng/L) December 180 January 210 February 120 March 130 April 10:30 AM 810 11:15 AM 210
Questions • Is there an analytical chemistry problem? • If there is an analytical chemistry problem then is the problem a. Qualitative? b. Quantitative? c. Both?
Analytical MethodU.S. EPA Method 1531 Revision EMercury in Water by Oxidation, Purge and Trap, Cold Vapor Atomic Fluorescence Spectrometry
Sampling must be accomplished using U.S. EPA Method 1669: Sampling Ambient Water for Determination of Trace Metals at EPA Water Quality Criteria Levels.MDL is 0.2 ng/L.
Laboratory/Samplers • Certified by the State for Methods 1669 and 1531. • Laboratory has a clean room for the low level mercury analysis. • Calibration from 0.5 to 100 ng/L is excellent.
Regression Data Concentration Area (ng/L) 0 16099 0.5 39979 1 67789 5 255863 10 440982 R2 = 0.999 25 1173163 50 2194860 100 4295252
Quality Control Precision Original analysis 210 ng/L 1st replicate 210 ng/L 2nd replicate 200 ng/L Each sample was diluted by a factor of 10.
Blanks Instrument Blank 16,748 16,289 17,442 Method Blank 21,459 = 0.1 ng/L 23,866
Method of Standard Additions(MSA) U.S. EPA SW-846, Method 7000A, Section 8.7 The standard addition technique involves adding known amounts of standard to one or more aliquots of the processed sample solution. This technique compensates for a sample constituent that enhances or depresses the analyte signal, thus producing a different slope from that of the calibration standards.
Spike Concentration Original Concentration Expected Concentration Measured Concentration 10 ng/L 20 ng/L 30 ng/L 40 ng/L 21 ng/L 21 ng/L 21 ng/L 21 ng/L 31 ng/L 41 ng/L 51 ng/L 61 ng/L 23 ng/L 31 ng/L 33 ng/L 34 ng/L Mercury Analysis by the Method of Standard Additions
Regression Data Spike Concentration Area (ng/L) 10 1088370 20 1461565 R2 = 0.809 30 1523412 40 1588011
Conclusion Accuracy of the Hg analysis is wrong. There may not be any Hg in the sample. The MSA can be used for any analysis as a check on its accuracy.