Download
1 / 11
110 likes | 293 Views
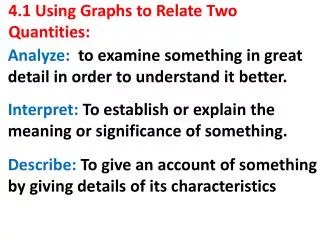
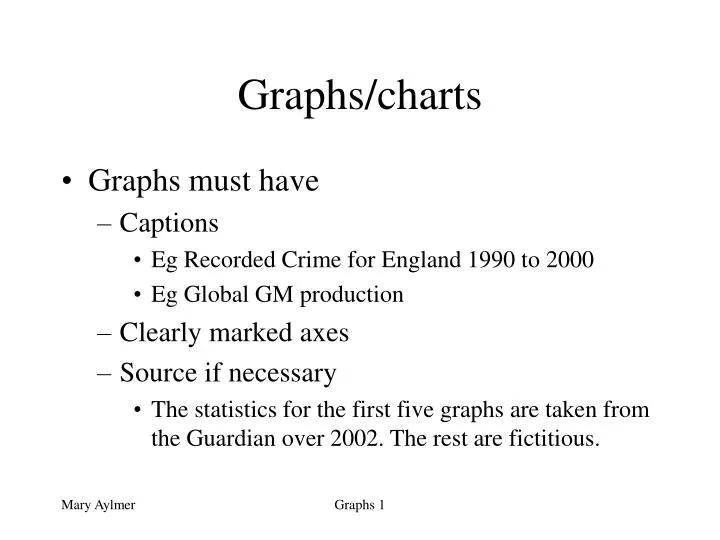
Graphs/charts. Graphs must have Captions Eg Recorded Crime for England 1990 to 2000 Eg Global GM production Clearly marked axes Source if necessary The statistics for the first five graphs are taken from the Guardian over 2002. The rest are fictitious.

E N D
Graphs/charts • Graphs must have • Captions • Eg Recorded Crime for England 1990 to 2000 • Eg Global GM production • Clearly marked axes • Source if necessary • The statistics for the first five graphs are taken from the Guardian over 2002. The rest are fictitious. Graphs 1
Column Chart 1 – comparisonsTotal tax per year for 1600cc car Graphs 2
Column Chart 2 – comparisonsEmployment in agriculture, forestry, hunting and fishing Graphs 3
Pie Charts - shares/allocationsLocal Authority Leisure spending Graphs 6
Select a chart type 1 Graph to show average commuting time It’s a comparison so use a Bar Chart Graphs 7
Select a chart type 2 Graph to show percentage of workers teleworking It’s a comparison so use a Bar Chart Graphs 8
Select a chart type 3 Percentage of individuals owning their own home in UK It’s a trend so use a Line Chart Graphs 9
Select a chart type 4 How the NHS spends its budget This shows how the budget is allocated so use a Pie Chart Graphs 10
Use your judgement • These are not hard and fast rules • Chose a graph type that • Displays clearly the information you are trying to give the reader • Look at graphs in the newspaper etc. • Why have they used that style? • Does it show the information clearly? Graphs 11