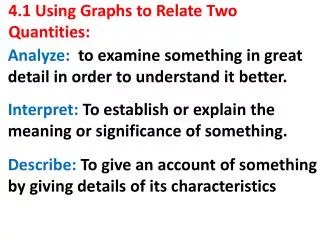
4.1 Using Graphs to Relate Two Quantities:
Analyze: to examine something in great detail in order to understand it better. 4.1 Using Graphs to Relate Two Quantities:. Interpret: T o establish or explain the meaning or significance of something. Describe: T o give an account of something by giving details of its characteristics.

4.1 Using Graphs to Relate Two Quantities:
E N D
Presentation Transcript
Analyze: to examine something in great detail in order to understand it better. 4.1 Using Graphs to Relate Two Quantities: Interpret: To establish or explain the meaning or significance of something. Describe: To give an account of something by giving details of its characteristics
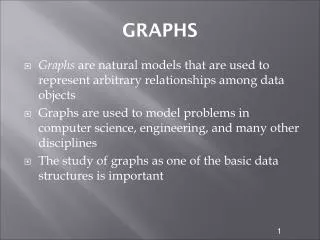
In math we use graphs to represent real world situations. A well rounded Algebra 1 student must be able to work with graphs and be able to: 1. Analyze graphs, 2. Match graphs to given situations, and 3. Sketch graphs
Analyzing Graphs: Given any graph, we must be able to describe the information it is providing by using the labeling (variables) of each graph. Ex:
Looking at the labels of the graph(variables), we can see that this graph has to do with volume of a balloon (vertical label: y-axis) over time (horizontal label: x-axis). This means, that as time goes by, the volume in the balloon increases.
YOU TRY IT: a) What are the variables in the graph? Temperatures of H20 Temp (Fo) b) Describe how the variables are related. Depth
YOU TRY IT: (Solution) Temperatures of H20 a) The variables are depth (Independent) and temperature (dependent) Temp (Fo) Depth b) The temperature of the water decreases as depth increases.
Matchinggraphs: Data from a table is often displayed using a graph to visually represent the relationship between the variables. It is our job to math the corresponding table with the graph. Ex:
Ex: Matchinggraphs: looking at the table, from point to point, we see that it increases rapidly from one to the other (not constant) which means it is not going to create a line. The answer is B.
YOU TRY IT: Match the graph to the proper situation.
YOU TRY IT: (SOLUTION) Match the graph to the proper situation. 4) C: The first point is (1, 50) 5) B: The first point is (1, 80) 6) A: The first point is (1, 60)
Sketching Graphs: Data from a given situation can be transferred to a graph. We must once again keep in mind the Independent variable (x) and the independent variable (y). JESSIE WAS HERE Ex:
YOU TRY IT: Sketch the graph to represent the following situation. 1) Suppose you want to buy several cans of soup that cost $2.00 each. How is the cost related to the number of cans you buy.
YOU TRY IT: (SOLUTION) We know that each can costs $2.00 Cost $ Cans The cost will vary DIRECTLY with # of cans.
VIDEOS: Graphs https://www.khanacademy.org/math/arithmetic/applying-math-reasoning-topic/reading_data/v/u08-l1-t2-we2-reading-line-graphs https://www.khanacademy.org/math/arithmetic/applying-math-reasoning-topic/reading_data/v/reading-bar-charts-1
CLASSWORK:Page 237-239 Problems: As many as needed to master the concept