Download
1 / 1
10 likes | 182 Views
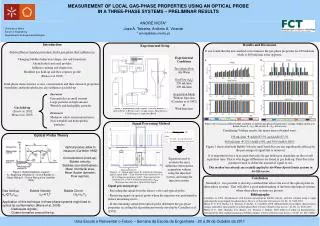
MEASUREMENT OF LOCAL GAS-PHASE PROPERTIES USING AN OPTICAL PROBE IN A THREE-PHASE SYSTEMS – PRELIMINAR RESULTS . 5. 6. 2. 4. ANDRÉ MOTA* José A. Teixeira, António A. Vicente * amota@deb. uminho.pt. 3. 1. Introduction

E N D
MEASUREMENT OF LOCAL GAS-PHASE PROPERTIES USING AN OPTICAL PROBE IN A THREE-PHASE SYSTEMS – PRELIMINAR RESULTS 5 6 2 4 ANDRÉ MOTA* José A. Teixeira, António A. Vicente * amota@deb.uminho.pt 3 1 Introduction Solids influence liquid-gas mixture. In the gas-phase their influence is: Changing bubbles behaviour (shape, rise and formation); Altered radial and axial profiles; Influence mixing and dispersion; Modified gas hold-up and flow regimes profile (Mena et al. 2005). Solid-phase characteristics as size, concentration and their chemical properties (wettability and hydrophobicity) also influence gas hold-up. Results and Discussion Experimental Setup It was found that the new method over estimates the gas-phase properties for 250 mL/min while to 400 mL/min is the opposite. Experimental Conditions Two-phase flow Air-Water Gas Flow (QG) 250 mL/min 400 mL/min Acquisition Mode Without Injection (Cartelier et al 1992) & With Injection A A B Increases Fine particles in small amount Large particles in high amount Wettable and hridophilic particles Decreases Moderate solid concentrations/sizes; Non-wettable and hydrophobic particles. Figure 2.Experiemntal Setup. Legend: 1. Air-Lift Reactor; 2. Optical Probe; 3. Electro valve; 4. Light source+ Photo detector; 5. Oscilloscope; 6. Acquisition Board Gas hold-up (Zon et al. 2002; Mena et al. 2005) Signal Processing Method Figure 4 Error obtained at different Add1 and Add 2 for different gas-phase characteristics: Voidage, Bubble velocity and Bubble Chord. A – QG= 250 mL/min; B – QG= 400 mL/min; Considering Voidage results, the minor errors obtained were: 250 mL/min Add1<37.5% and Add2<37.5% 400 mL/min 25%<Add1<50% and 50%<Add2<100% Optical Probe Theory Figure 3 shows thatbothBubbleVelocityandChordSize are notsignificantlyaffectedbythepercentageofsignalthatisremoved. It is important to have in account that only the gas hold-up is dependent on the overall aquicition time. That is why bigger differences are found in gas hold-up. Thus this is the parameter used to define the amount of signal to cut. Optical probes allow to measure:(Cartellier 1992) Concentrations (hold-up); Bubble velocity; Bubbles size distributions; Mean interfacial area; Mean Sauter diameter; Flow regimes. dtREM Equations used to evaluate the error difference between the acquisition without using the injection system, and using the injection system. Thismethodwasalreadysuccessfullyapplied to Air-Water-SpentGrainssystemsinAir-lift reactor. Figure 1. Bubble Detection. Legend: A – Beginning of Bubble; B – End of Bubble; C – Begin Rising; D – End of Rising (from Cartellier 1992). Figure 3. A – Optical probe signal. B – Electrovalve Injection signal. Legend:Add1 – Time removed before injection (0 % to 50 % of Injection peak time); Add2 – Time removed after injection (0 % to 100 % of Injection peak time);dtREM – Maximum time removed in Optical Probe Signal. Conclusion Generallyitwaspossible to develop a methodthatallowsthe use oftheopticalprobeinthree-phasesystems . Thiswillallow a goodunderstandingofthebiotechnologicalsystemswherethree-phasesystems are present. • Signal processing steps: • Recording the signal from the electro-valve and optical probe; • Removing signal on optical probe where the injection was performed to reduce measuring errors. • In the remaining signal from optical probe determine the gas phase properties according the algorithm previously develop by Cartellier et al. (1992). • Gas hold-up Bubble Velocity Bubble Chord • eg=∑TG/tacqvB=A.TuBchB=vB.TG • Application of this technique in three-phase systems might lead to optical tip contamination (Mena et al. 2008): • Inadequate signals; • Cluster formation around the tip. Bibliography Cartellier, A. 1992. Simultaneous void fraction measurement, bubble velocity, and size estimate using a single optical probe in gas-liquid two-phase flows. Review of Scientific Instruments, 63, Nr. 11, 5442-5453. Mena, P. C., F.A. Rocha. J.A. Teixeira. P. Sechet. A. Cartellier. 2008. Measurement of gas phase characteristics using a monofibre optical probe in a three-phase flow. Chemical Engineering Science, 63, Nr. 16, 4100-4115. Mena, P. C., M.C. Ruzicka. F.A. Rocha. J.A. Teixeira, J. Drahos. 2005. Effect of solids on homogeneous–heterogeneous flow regime transition in bubble columns. Chemical Engineering Science, 60, Nr. 22, 6013-6026. A B