Download
1 / 57
570 likes | 714 Views
Using EVAAS to Improve Student Performance Robin Loflin Smith, Ed.D. Mary Keel, Ed.D. Region 2 PD Leads NCDPI. Outcomes. Overview of EVAAS Growth Model Interpreting Value-Added Reports Interpreting Diagnostic Report Helping teachers use their individual data.

E N D
Using EVAAS to Improve Student PerformanceRobin Loflin Smith, Ed.D.Mary Keel, Ed.D.Region 2 PD LeadsNCDPI
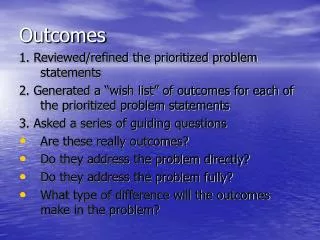
Outcomes • Overview of EVAAS Growth Model • Interpreting Value-Added Reports • Interpreting Diagnostic Report • Helping teachers use their individual data Note: Slides marked with * are from SAS.
All students deserve opportunities to make appropriate academic progress every year. There is no “one size fits all” way of educating students who enter a class at different levels of academic achievement. Adjustments to instruction should be based on the academic attainment of students, not on socio-economic factors. Given reliable information on past effectiveness, educators can make appropriate adjustments to improve student opportunities. "What teachers know and can do is the most important influence on what students learn." (National Commission on Teaching and America's Future, 1996) One of the most important things educators can know is with whom they are effective and where they need to develop new skills.. Underlying EVAAS Philosophy * SAS
Achievement and Poverty * SAS
Academic Growth and Poverty No one is doomed to failure. * SAS
Benefits for Principals Gain a consolidated view of student progress and teacher effectiveness, as well as the impact of instruction and performance. Bring clarity to strategic planning and function as a catalyst for conversations that must take place to ensure that all students reach their potential. Understand and leverage the strengths of effective teachers. Use the valuable resource of effective teaching to benefit as many students as possible.
2012-13 Changes in Reporting 2011-12 2012-13 Above Exceeds Expected Growth Not Detectably Different Meets Expected Growth Below Does Not Meet Expected Growth
Value-Added Reporting Projections Predictions
North Carolina uses two different models in EVAAS • The Univariate Response Model (URM) is used for EOGs in grades 5 and 8 science, EOCs in high school, and CTE Post-Assessments; URM will be used for the Common Exams (predicts) • The Multivariate Response Model (MRM) is used for EOGs in grades 3 – 8 mathematics and English Language Arts (projects)
Predict/Project The URM uses a student’s prior test scores to predict where a student will be positioned in the statewide distribution of students who take a certain assessment The MRM uses a student’s prior test scores to project where students will be positioned in the statewide distribution of students who take a certain assessment In both cases, the basic methodology is the same: using a student’s prior test scores to consider their performance on an assessment he or she will take at the end of the school year
Predictive VA Model –Univariate Response Model (Predicts) • For reports where testing is not sequential (gr. 5 and 8 science, EOCs in high school, CTE post-assessments) • Common Exams • Students must have three previous test scores for a predictive model • Effect is difference between predicted and observed scores
Value-Added Reporting The NCE Base is by definition set at 50.0, and it represents the average attainment level of students in the grade and subject, statewide. If the school mean is greater, the average student in the school is performing at a higher achievement level than the average student in the state.
District Diagnostic Reports Use to identify patterns or trends of progress among students expected to score at different achievement levels
What would an ideal pattern on a Diagnostic Report look like for closing the achievement gap?
Overview of School Effects Overall Results: if color is red Blue bars above the green line Blue bars below the green line Blue bars at/near the green line or whiskers cross green line
Student Pattern Report – Key Questions Different experience? Different strategies? Different needs? Number of hours?
Student Pattern Report – Key Questions Different experience? Different strategies? Different needs? Number of hours? YES! Rerun the report with new criteria.
Student Pattern Report – Next Steps 16 Students who attended for 40+ hours All 31 Students in the Program
Less Informed Conclusion: We need to change the selection criteria for this program. More Informed Conclusion: We need to adjust the recommended hours for participants.
Student Achievement Proficient End of School Year
Student Growth Proficient Change over time Not Proficient Start of School Year End of School Year
Achievement vs. Growth Student Achievement: Where are we? • Highly correlated with demographic factors Student Growth: How far have we come? • Highly dependent on what happens as a result of schooling rather than on demographic factors
Evaluation Composite Index: Teacher Estimate Divided by Standard Error Courses included in calculation Statewide distribution of teacher status.
Effectiveness Categories State Growth Standard/State Average = 0.0 Standard Error = a measure of uncertainty Usually, the more data, the smaller the standard error (small vs. large # of students) Index = Teacher Estimate divided by its Standard Error (higher is better) Index is 2 or higher Index is equal to or greater than a -2 but less than +2 0.0 Index is less than -2
Things to remember: • Teacher estimates are individual and cannot be compared • Larger number of students means more certainty; confidence band around the estimate grows when there’s more uncertainty • Must have 6 fulltime students for math or reading EOG; minimum of 10 if teaching a predictive course if responsible for 60% of their instruction • Enrolled 140 days or 70 days for the semester • The estimate is really the teacher effect • Indexes can be compared; higher is better (2+ = exceeds) • Teacher model gives teachers the benefit of doubt; outliers, shrinkage, etc.
EVAAS Teacher Value Added Report Supplemental Information Table
Divide teacher estimate by Std. Error for Index EVAAS Teacher Value Added Report
Making Generalizations • What generalizations can we make? • What do we not know? • How do we find out?
Using Data to Drive Crucial Conversations What’s a Crucial Conversation? And Who Cares? A crucial conversation is a discussion between two or more people where stakes are high, opinions vary, and emotions run strong. When we face crucial conversations, we can do one of three things: We can avoid them, we can face them and handle them poorly, or we can face them and handle them well. Ironically, the more crucial the conversation, the less likely we are to handle it well. • www.wikisummaries.org