Download
1 / 21
210 likes | 357 Views
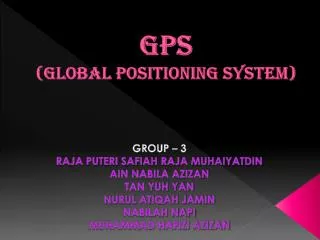
The System of World Cities: Studying Suburbanization Since 1970 Satellite Imagery. John R. Weeks International Population Center Department of Geography. Christopher Chase-Dunn, Alexis Alvarez and Daniel Pasciuti Institute for Research on World-Systems University of California-Riverside.

E N D
The System of World Cities:Studying Suburbanization Since 1970 Satellite Imagery John R. Weeks International Population Center Department of Geography Christopher Chase-Dunn, Alexis Alvarez and Daniel Pasciuti Institute for Research on World-Systems University of California-Riverside
Sustainable Urbanization • Is sprawl accelerating or slowing down? • Megacities and City regions: 250 World Cities and 10 city-regions • Measuring sprawl: a methodology for measuring the rates and the nature of the areal expansion of world cities and the patterns of decreasing population density • Ridd’s VIS Model • The Urban Gradient
Measuring sprawl: a methodology for measuring the rates and the nature of the areal expansion of world cities and the patterns of decreasing population density When we see a satellite image, such as this of Cairo, can we use it to describe what is on the ground at this point?
Impervious Surface 0 100 CBD High density residential Light industry Percent Soil 50 50 Medium density residential Percent Impervious Low density residential Heavy industry 100 0 Lawn Cover Crops Forest Row Crops Range land Desert Bare Soil Vegetation Soil 100 50 0 Percent Vegetation Ridd’s V-I-S Model of the Urban Scene Source: M. Ridd, 1995. “Exploring a V-I-S (Vegetation-Impervious Surface-Soil) Model or Urban Ecosystem Analysis Through Remote Sensing: Comparative Anatomy of Cities,” International Journal of Remote Sensing 16:2165-2185 Cities Agriculture Wilderness
THE URBAN GRADIENT MAY BE DISCONTINUOUS City: largely impervious surface Our focus Level of urbanness Agricultural: mix of vegetation and bare soil Wilderness: largely bare soil Spectral properties of land cover
Study Site Menoufia Governorate Greater Cairo
SPATIAL UNIT OF ANALYSIS: Initially we use the administrative units from the census, so that we can compare our imagery results with the census results. The long-term goal is to produce a gridded surface, perhaps 0.25 km, that can be compared more precisely over time.
CREATING AN URBAN GRADIENT INDEX: We begin with the assumption that we are indexing places, not people. Once the spatial unit of analysis is determined, then the following issues must be dealt with in the creation of an index: (1) the variables to be combined in the index; and (2) how the variables will be combined to create an index.
VARIABLES THAT ARE CANDIDATES FOR THE URBAN GRADIENT INDEX: • Imagery-Derived • Vegetation fraction • Shade/water fraction • Impervious surface fraction • Bare soil fraction • Landscape metrics—measures of spatial complexity and configuration • Census-Derived • Total population • Population per sq km • Percent of males not in agriculture
Spatial Distribution of Change in Image-based Urban Gradient: 1986-1996
CONCLUSIONS: By developing a quantitative measure that is comparable from place to place and time to time, we have the potential to compare regions on the basis of a score that reflects important elements of the built environment that will enable us to study changing rates of suburbanization and the world city size distribution.
For more information, visit our websites: http://typhoon.sdsu.edu/Research/Projects/ Aftweb/AFT-main.htm http://irows.ucr.edu/research/citemp/ citemp.html