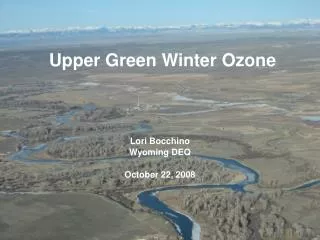
Upper Green Winter Ozone
Upper Green Winter Ozone. Lori Bocchino Wyoming DEQ October 22, 2008. Presentation Overview. Background Field Study Overview Model Development What’s next. Warbonnet 20 Feb 2008. Background. Oil & Gas activity growth Historical ozone levels Unique features of SW WY ozone episodes.

Upper Green Winter Ozone
E N D
Presentation Transcript
Upper Green Winter Ozone Lori Bocchino Wyoming DEQ October 22, 2008
Presentation Overview • Background • Field Study Overview • Model Development • What’s next Warbonnet 20 Feb 2008
Background • Oil & Gas activity growth • Historical ozone levels • Unique features of SW WY ozone episodes
AQD Monitoring Site 4th high 8-hour ozone values (ppm) These sites have 3 complete years of data for 2005-2007
Unique Features of SW WY Ozone Episodes • Winter events • Low sun angle • Cold temperatures • Rural location • Low Population • No PSD major industrial sources • All Minor source oil & gas, compression • Limited mobile source activity?
Initial Theories • Monitoring error, possible interferences • Stratospheric Intrusion • Transport • Locally Formed Jonah 12:00 2/27/06 O3 conc. = 103 ppb
Upper Green Winter Ozone Study Field Study Overview
Field Study Objectives • Develop a more complete characterization of winter ozone events in the Upper Green River Basin • Provide data for • Development of a conceptual model of ozone formation • More accurate numerical simulations of high ozone events
Study Approach • Study design based on 2005 & 2006 high ozone event data • Identify meteorological and air quality modeling data requirements • Identify data needed to evaluate initial theories • Develop episode forecasting protocol • Conduct measurements February - March 2007 and mid-January – March 2008 • Continuous Measurements to supplement existing network • Intensive Operating Periods (IOPs)
UGWOS Continuous Sampling • Routine data collection at existing sites (Boulder, Jonah, Daniel South, Pinedale-CASTNET) • Airport operations • FRM O3 analyzer • Winds • Profiler Site (RWP) • Sfc winds, temp • RWP/RASS/SODAR (2007) • Mini-SODAR (2008) • Mesonet • Winds and ozone (Speedway, Big Piney and Mesa operated in 2007)
UGWOS IOP Measurements • Rawinsonde/ozonesonde at airport: 8:00, 11:00, 13:00, 17:00 • VOC/Carbonyl sampling • Three hour integrated samples at Jonah, Boulder, Daniel: 4:00 – 7:00, 9:00 – 12:00, 14:00 – 17:00 MST • Aircraft grab samples • Aircraft • Morning and afternoon flights • O3 (KI), PM2.5 (DustTrak) • Temperature, Pressure
Forecasting for IOPs • Used NWS models GFS and NAM • High Pressure Axis Approaching or Over Western Wyoming • Low Wind Speeds Aloft and at Surface • Warmer Temperatures Aloft • Colder Surface Temperatures • Strengthening Inversion • Significant Snowpack
Upper Green Winter Field Study Results
What is the background ozone concentration? • Operational definition of background: • What are ozone concentrations at CASTNet? • What are concentrations outside of study area during events? • What are concentrations inside study area when favorable conditions are not present? • 55 ppb
2007 Field Study Opportunities for Elevated Ozone • Meteorology did not set up as in 2005 and 2006 • Few opportunities for elevated levels • Saw episodes on 8-hour concentrations in low-to-mid 60 ppb • Called one IOP March 16-19
Notable events during 2007 • Lack of snow cover, local surface heating produced high temps during days resulted in deep mixing. • Mornings were calm but winds in afternoon were too strong to run tethered balloons and aircraft. • Collected data regarding UV radiation and reflection • Tracked microscale wind flow around the Basin • Analyzed VOC samples taken during IOPs • Big red balloons were too tempting for neighbors looking for target practice in off-season.
Snow Cover From: NOAA National Operational Hydrologic Remote Sensing Center Snow Depth 02-19-2008 (IOP #1) Snow Depth 02-19-2007
Photos from Boulder Visibility Camera Feb. 19, 2008 Feb. 19, 2007
Vertical Profiles and Mixing Heights • Inversions inhibit mixing
Role of Mixing Heights SODAR Mixing Height Daily Max 8-Hr Avg O3 at Boulder • Elevated O3 when MH < 150 m agl • Note mini-SODAR max range = 250 m agl
Ozone 18 – 21 February 2008 Boulder 122 ppb on 21 Feb
February 18, 2008 • Prevailing, strong winds from the NW • Well-mixed atmosphere • Regionally uniform ozone concentrations, with 8-hour averages from network sites less than 60 ppb
February 18, 2008 PM • Regionally low “baseline” ozone concentration of about 55 ppb
February 19, 2008 • High pressure over area • Stable surface layer • Significantly higher ozone concentrations reported by some network sites, including an 8-hour average of 80 at Jonah • Rapid development of high concentrations relative to clean conditions on February 18
February 19, 2008 • After initial NW winds in early morning, winds become regionally light and variable
February 19, 2008 AM • Airport profile shows strong surface inversion • Similar surface inversion of 10º to 15ºC were uniquely present during the mornings of all high ozone days
February 19, 2008 PM • Profile shows surface inversion with low wind speeds, restricting mixing • Higher ozone concentrations developing near surface
February 19, 2008 PM • High ozone concentrations in Jonah area • High concentrations well into foothills
February 20, 2008 • Continued high pressure, stable conditions • Ozone concentrations again develop over course of day • O3 > 75 ppb 8-hour avg. at Boulder, Daniel, Warbonnet, and Simpsons Gulch
February 20, 2008 • Continued mostly light and variable winds • Note afternoon winds in Jonah/Warbonnet area somewhat stronger and from the SE
Surface Winds, 20 Feb 2008 6:00 9:00 12:00 15:00 Times are MST
February 20, 2008 AM • Higher morning concentrations than previous days • No definitive areas of significant ozone carryover • Higher concentration over the New Fork river may be more a function of time (late in the flight)
February 20, 2008 PM • Vertical profiles show continued inversion, limited mixing, and “baseline” conditions above inversion Balloon Sounding at Pinedale Airport (Wenz Field) Aircraft Spiral Flight Pattern Sounding over Boulder
February 20, 2008 PM • Surface network misses high values W-SW of The Mesa • O3 peaks south of Jonah mid-afternoon consistent with NW morning winds switching to SE • O3 peaks NW of Jonah in late afternoon consistent with SE afternoon winds • Full spatial extent of high readings in southern portion of study area not well defined
February 21, 2008 • Continued high pressure, stable conditions • Ozone concentrations again develop over course of day • 8-Hour avg O3 > 75 ppb at all sites except Daniel and Cora • 8-hour average of 122 ppb recorded at Boulder – the highest for the year
February 21, 2008 • Continued mostly light and variable winds • Note afternoon winds at Warbonnet more southerly than previous days
February 21, 2008 AM • Again, no obvious ozone carryover from previous day, but ozone concentrations above “baseline”
February 21, 2008 PM • Peak concentrations at Boulder consistent with a Jonah source and southerly winds • High readings also noted in southern portion of study area – extent not well defined • Readings consistent with surface network data
March 11, 2008 PM • Highest readings recorded by aircraft during study, though beyond surface network coverage • Readings consistent with network-reported data (O3 > 75 ppb at Boulder, Jonah, Airport, and Haystack Butte, with Simpsons Gulch also high)
Summary of key finding from IOPs • Periods of high ozone characterized by stable conditions, surface inversion, low surface mixing height, and low surface winds • Polluted conditions can develop very quickly – within 24 hours of clean conditions • High ozone can occur anywhere in the study area; depending on meteorology • Southern extent of high O3 values not well characterized by these data
UV Radiation – UGWOS 2008 • Data quality issues with UV readings (out > in) • Loss of snow-reflected UV in mid-March
March 23, 2008 Flight • Though not conclusive, higher concentrations appear to correlate with areas of greater snow cover
Upper Green Winter Ozone Study Ozone Precursors