Download
1 / 20
200 likes | 380 Views
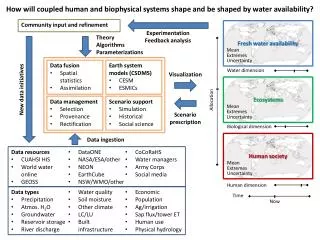
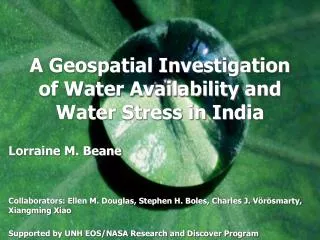
A Geospatial Investigation of Water Availability and Water Stress in India. Lorraine M. Beane Collaborators: Ellen M. Douglas, Stephen H. Boles, Charles J. Vörösmarty, Xiangming Xiao Supported by UNH EOS/NASA Research and Discover Program. Overview. Rationale Goals

E N D
A Geospatial Investigation of Water Availability and Water Stress in India Lorraine M. Beane Collaborators: Ellen M. Douglas, Stephen H. Boles, Charles J. Vörösmarty, Xiangming Xiao Supported by UNH EOS/NASA Research and Discover Program
Overview • Rationale • Goals • Tools and Methods of Analysis • Climate based data • Remote sensing data • Ground based data
Previous Studies • Vörösmarty et al (2003) study of geospatial indicators of water stress for Africa using river discharge, climatic indicators, and water demand • Melloul and Collin (2002) water management and sustainable development of Israel's coastal aquifer • Khazaei, Spink, and Warner (2003) estimating groundwater recharge in arid and semi-arid regions of Iran • Vörösmarty et al (2000) the effects of climate change, population growth, and other human impacts on global water resources
Research and Water Resources in India • India has been recognized as a country under water stress by UN agencies and many academic organizations • Population is single largest contributing factor (>1 billion) • Water stress is particularly evident in rural areas where 80% of drinking water and more than 50% of irrigation waters come from groundwater supplies (UNEP) • India has recently become a focal point for hydrologic research • India leads the world in total irrigated area • Land irrigated by surface water doubled in area from 1950 to 1985. In same period of time groundwater irrigation increased 113-fold (Sampat, 2000)
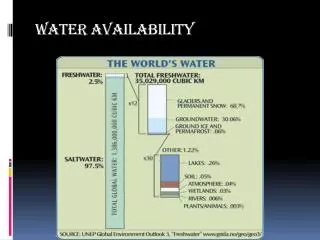
Climate • India’s climate is monsoonal • Two major periods of rain • South-west monsoon from June and September affect the central region • North east monsoon from October to November affect the northern and southern regions • Average annual precipitation is 1.05 m • Spatial and temporal distribution restrict utilization of precipitation as a source of freshwater
Humid Arid Semi-arid CMI • Climatic moisture index (CMI) is defined as: PPT/PET–1 if PPT<PET OR 1–PPT/PET if PPT>PET where PPT is potential precipitation and PET is potential evapotranspiration • Moist climates have positive CMI values while dry climates have negative CMI values Sub-humid Annual average CMI calculated from monthly data 1960-1995
Monthly CMI Monthly CMI data averaged from 1960 to 1995
WaterUsage 5% 8% 87% Arid cropland Semi-arid cropland Sub-humid cropland Humid cropland Agriculture Domestic Industry • Since most crops are grown in arid and semi-arid regions and most agriculture in India is irrigated instead of being rain fed, then a significant portion of freshwater resources are being used for irrigation Cropland and Climate (FAO-AQUASTAT)
Goals • To apply a method for identifying irrigated areas using remote sensing data to India • To delineate the source of irrigation (groundwater versus surface water use) • To evaluate sustainable versus unsustainable irrigation in India
MODIS • Moderate resolution imaging spectroradiometer • NASA satellite • Analysis of two tiles (H25 V06 and H25 V07) • 1/1/02 to 12/31/02 • Spatial resolution of 500 m • Revisit time is daily • Eight day composite product H25 V07 on November 1, 2002 • Filtered for cloud coverage and permanent water bodies • Converted to geographic projection • Indexes calculated to identify rice fields and irrigation patterns • Use combination of near IR, short wave IR, blue and red wavelengths to detect and enhance reflectance of water and vegetation
Comparison of averaged index values at ROI 8 0.9 EVI 0.8 0.7 NDVI 0.6 LSWI 0.5 0.4 0.3 0.2 0.1 0 -0.1 -0.2 360 0 60 120 180 240 300 Julian Calendar Day • Normalized difference vegetation index OR NDVI = (nir – red)/(red + nir) • Land surface water index OR LSWI = (nir – swir)/(nir + swir) • Enhanced vegetation index OR • EVI = (2.5*(nir – red))/(nir + 6*red – 7.5*blue + 1) • (Huete, A.R. et al, 1997) NDVI EVI LSWI Index Profile from Region of interest #8 H25 V06 and H25 V07 rice map composite (Xiao, X. et al, 2002)
Irrigated Agriculture Irrigated Intensive Agriculture Rainfed Agriculture Slope Agriculture Irrigation and Agriculture • Used Global Landcover 2000 (GLC2000) as a comparison to actual land cover • More generalized picture of agriculture for all of India
Water Balance FAO AQUASTAT: • Q = 1261 km3/yr • 1222 km3/yr becomes surface water • 418 km3/yr becomes groundwater, with 380 km3/yr being shallow baseflow • 418 km3/yr – 380 km3/yr= 38 km3/yr as deep recharge • 1% of annual precipitation becomes recharge for deep aquifers
Sources of Water Supply for Irrigation • In some areas of India enough water is supplied by rivers and dug irrigation canals due to India’s extensive river network India’s river network
1995 irrigation water use Irrigation • In other areas groundwater is needed to supplement surface water to fulfill irrigation needs • May lead to exploitation of groundwater resources • Irrigation need = (PET – ET)/Irrigated cropland = 441 km3/yr countrywide for India • 41% of average annual renewable freshwater is needed for irrigation • In 1995 water used for irrigation = 558 km3/yr • 80 % efficiency Per km2
Summary and Conclusions • Freshwater supplies are not distributed evenly in India. • There is substantial spatial and temporal variation of the CMI. • India is consuming more freshwater than is annually renewable in certain regions. • The deficit is greatest in the Northwest where it is most arid and the population is densest. • The groundwater supply is spatially variable. • We suspect that usage of groundwater as a supplement to surface water for agricultural use is not a sustainable practice in many areas. • Remote sensing data can be used effectively to identify flood irrigated crops and to show precise timing of large-scale irrigation events.
Future Work • Careful mapping of domestic and industrial supply • Groundwater and surface water inputs to obtain a better understanding of sustainability • Incorporate aquifer map • As an end-user of NDWI/EVI MODIS irrigation identification methods continue to apply and assess impact on water resources • Complete retrospective analysis (1975-2000) and future projections (present-2025) of water supply in India • Refine study to higher resolution (6’)