Download
1 / 24
240 likes | 343 Views
Explore observed climate-related trends in the global freshwater system, impacts on groundwater recharge, and societal interdisciplinary issues involving water resources. Discuss challenges and potential solutions for sustainable water management.

E N D
Changing Water Availability Venkat Lakshmi
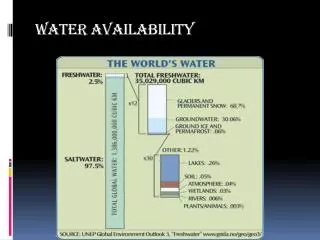
The Science issue 25 AUGUST 2006"Freshwater Resources"Vol. 313 (#5790) Pages 1016-1145 has devoted • an entire section to the description of freshwater • issues, namely- • Global water cycle and freshwater supply • Pollutants in the aquatic system • Waterborne diseases • Sustainability • Desalination Global Freshwater
Table 3.1. Climate-related observed trends of various components of the global freshwater system. Observed climate-related trends Precipitation Increasing over land north of 30°N over the period 1901–2005. Decreasing over land between 10°S and 30°N after the 1970s Increasing intensity of precipitation Cryosphere Snow cover Decreasing in most regions, especially in spring Glaciers Decreasing almost everywhere Permafrost Thawing between 0.02 m/yr (Alaska) and 0.4 m/yr (Tibetan Plateau) Surface waters Streamflow Increasing in Eurasian Arctic, significant increases or decreases in some river basins Earlier spring peak flows and increased winter base flows in Northern America and Eurasia Evapotranspiration Increased actual evapotranspiration in some areas Lakes Warming, significant increases or decreases of some lake levels, and reduction Groundwater No evidence for ubiquitous climate-related trend Floods and droughts Floods No evidence for climate-related trend but flood damages are increasing Droughts Intensified droughts in some drier regions since the 1970s Water quality No evidence for climate-related trend Erosion and sediment transport No evidence for climate-related trend Irrigation water demand No evidence for climate-related trend
The human dependence on water has been exemplified by various disturbances such as failure of crops during periods of droughts, lack of quality freshwater during floods, human development and the reduction of recharge to groundwater. SOCIETAL INTERDISCIPLINARY ISSUES INVOLVING WATER The interaction between the biosphere and the atmosphere is controlled in most part by the movement of water via the process of evaporation and transpiration. The changes in the biosphere results in changes in these fluxes which result in feedback to the local and regional hydrometeorology as well as systematic changes in global climate. BIOSPHERE
The warmer future climate leads to an increase in the length of the growing season, so that the region’s soils return to field capacity later in the autumn and start drying out sooner in the spring. This leads to a reduction in the length of the recharge period as shown in Fig. 5. East Anglia UK watershed Fig. 5 Change in the average annual potential recharge period (compared to the Baseline) in the 2050s High climate change scenario Climate change impacts on groundwater recharge-uncertainty, shortcomings, and the way forward? I. P. Holman Hydrogeology Journal (2006) 14: 637–647
• Simple direct estimations of climate-change-only impacts on groundwater (assuming current land use distributions) in areas where: – current groundwater resource management is sustainable, and there are significant unutilized resources; – there are few groundwater-sensitive wetlands or aquatic systems; – such estimations demonstrate only minor impacts on groundwater recharge and sustainable water resource management, which is supported by sensitivity analysis. • Partially integrated assessments in areas where: – current groundwater resource management is sustainable, but there is little unutilized resources; – agricultural systems are prone to significant change, either short term due to changes in subsidies or environmental legislation; or longer term due to climate-change-induced changes in crop suitability; – spatial development planning pressures suggest significant possible increases in urban development; – land use and groundwater recharge quality may be sensitive to future coastal defence policy of managed re-alignment and resultant inundation of coastal lowlands. • Fully integrated assessments in areas where: – current groundwater resource management is unsustainable; or – there are important groundwater-sensitive wetlands or aquatic systems and current groundwater resources management
Hydrological Sciences–Journal–des Sciences Hydrologiques, 52(2) April 2007 Future long-term changes in global water resources driven by socio-economic and climatic changes JOSEPH ALCAMO, MARTINA FLÖRKE & MICHAEL MÄRKER Center for Environmental Systems Research (USF), University of Kassel, Kurt-Wolters-Strasse 3, D-34109 Kassel, Germany Water stress indicates the intensity of pressure put on water resources and aquatic ecosystems by external drivers of change. Generally speaking, the larger the volume of water withdrawn, used and discharged back into a river, the more it is degraded and/or depleted, and the higher the water stress. The higher the water stress, the stronger the competition between society’s users and between society and ecosystem requirements (Raskin et al., 1997; Alcamo et al., 2003a). A level of severe water stress indicates a very intensive level of water use that likely causes the rapid degradation of water quality for downstream users (where wastewater treatment is not common) and absolute shortages during droughts. “Water stress” also includes the pressure on water resources caused by climate change, in the sense that climate change could lead to changes undesirable to society (e.g. reduced average water availability), or to aquatic ecosystems (e.g. unfavourable changes in river flow regime).
Fig. 1 Water stress in the 2050s for the A2 scenario based on withdrawals-to availability ratio. “Water withdrawals” are the total annual water withdrawals from surface or groundwater sources within a river basin for various anthropogenic uses (excluding the maintenance of aquatic or riparian ecosystems). “Water availability” corresponds to annual river discharge, that is, combined surface runoff and groundwater recharge.
Changes in precipitation will raise or lower the average volume of river runoff. Meanwhile, the expected increase in air temperature intensifies evapotranspiration nearly everywhere, and hence reduces runoff. These two effects interact differently at different locations and produce the net increase or decrease in water availability shown in Fig. 7. Since evapotranspiration increases nearly everywhere, it tends to counteract the effect of increasing precipitation wherever it occurs. Hence, the area of increasing water availability is somewhat smaller than the area of increasing precipitation. For example, under scenario A2 in the 2050s, 57% of the Earth’s land area has increasing annual precipitation (relative to the climate normal period) as compared to 51% having increasing annual water availability.
Fig. 7 Change in average annual water availability between climate normal period (1961–1990) and the 2050s under the A2 scenario.
While increasing water availability could have a positive influence on society by reducing river basin water stress, an increase in water availability in one season may not be beneficial during that season, nor transferable to another season. An increase in annual water availability may also be accompanied by a higher risk of extremely high and damaging runoff events. For the 2050s, under the A2 scenario, we estimate a significantly increasing risk of higher runoff events over 10.5% of total global river basin area (using an indicator described in the caption of Fig. 8). Included are many humid regions, such as northern Europe, western India, northern China and Argentina (Fig. 8). For the same scenario and period, 16.3% of the global area of river basins may be subject to more frequent low runoff events (Fig. 8), including such arid regions as southern Europe, Turkey and the Middle East.
Fig. 8 Change in extreme runoff events. This figure depicts different combinations of changes in mean precipitation and the coefficient of variation of runoff. Computed by the WaterGAP model (A2 emission scenario, for the 2050s, ECHAM climate model). Orange indicates a decline between 5 and 25% in annual precipitation and an increase in the coefficient of variation of runoff of between 5 and 25%. Red indicates a decline of more than 25% in annual precipitation and an increase in the coefficient of variation of runoff of more than 25%. Light blue indicates an increase between 5 and 25% of annual precipitation and the coefficient of variation of runoff, and dark blue an increase of more than 25%.
Fig. 1. Worldmapshowing the links between undernutrition and hydro-climatic preconditions. Prevalence of undernourished in developing countries is shown at the country level as the percentage of population 2001–2002. Hydro-climatic distribution of semiarid and dry-subhumid regions are shown in gray. These regions correspond to savanna and steppe agro-ecosystems, dominated by sedentary farming and subject to extreme rainfall variability and high occurrence of dry spells and droughts.
Figure 5. Percentage increases in annual and winter effective runoff for 2041–2070 and 2061–2090 scenarios.
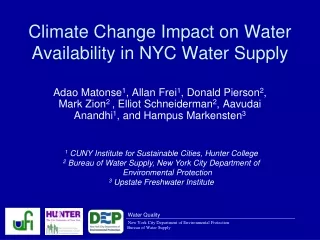
Although the studies assessing the impacts of climate change on California hydrology have differed in their methodological approach, their results tend to agree in certain critical areas. Results consistently show that increasing temperatures associated with climate change will impact Californian hydrology by changing the seasonal streamflow pattern to an earlier (and shorter) spring snowmelt and an increase in winter runoff as a fraction of total annual runoff (see Figure). These impacts on hydrology vary by basin, with the key parameter being the basin elevation relative to the ‘freezing line’ during snow accumulation and melt periods and the prediction of temperature increases The evolution of climate change impact studies on hydrology and water resources in California S. Vicuna & J. A. Dracup Climatic Change (2007) 82:327–350
IPCC Freshwater Resources and their management WG 2 Chapter 3 Figure 3.8. Illustrative map of future climate change impacts on freshwater which are a threat to the sustainable development of the affected regions. Ensemble mean change of annual runoff, in percent, between present (1981 to 2000) and 2081 to 2100 for the SRES A1Bemissions scenario (after Nohara et al., 2006).
Global population increase in all continents between 1950s and 2050 has put a big strain on water resources Population “centers” include China, India, North America.
Impact of population • The increase in global population has decreased the per capita water availability • Consider for example the changes between 2000 and 2004
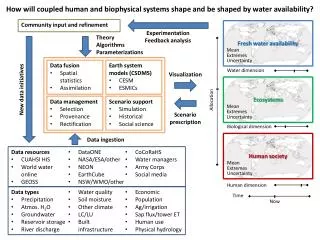
Philosophy • As we can see there have been numerous climate change impact studies on local water resources – watershed level activities • There has been statistical analysis of population impact on water availability • What should this chapter convey? This chapter should integrate the micro and macroscale studies so that we can get the complete picture.
Introduction Stresses due to: Climate change Population increase Quantifying water resources: Lakes, Rivers, glaciers, groundwater, precipitation Data and Methods IPCC reports on climate change Monitoring Measurement of water resources: In-situ and satellite remote sensing Models for estimation of water resources Future scenarios Case Studies California; Great Lakes; Colorado River Basins Czech Republic; Rhine Taiwan; Tarim and Yellow River Basin Swaziland Arctic Transboundary disputes Floods and droughts and natural disasters Key Uncertainties policy framework [cross with Chapter 9]